Question: Help - Print Save Decisions E Company - Year 11 (practice) Decisions / Reports Menu WORKFORCE COMPENSATION & TRAINING Latin America Facility Prior-Year Compensation and
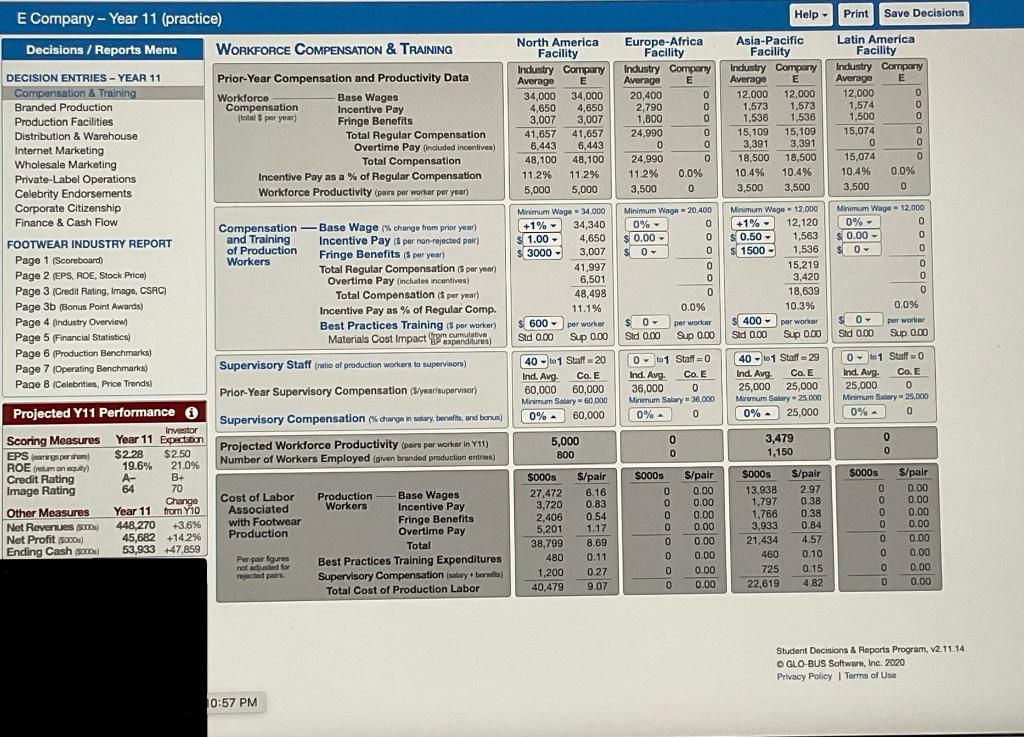
Help - Print Save Decisions E Company - Year 11 (practice) Decisions / Reports Menu WORKFORCE COMPENSATION & TRAINING Latin America Facility Prior-Year Compensation and Productivity Data Workforce Base Wages Compensation Incentive Pay total $ per year) Fringe Benefits Total Regular Compensation Overtime Pay included incenlives) Total Compensation Incentive Pay as a % of Regular Compensation Workforce Productivity (pain per worker per year) North America Facility Industry Company Average E 34,000 34,000 4,650 4,650 3,007 3,007 41.657 41.657 6,443 6,443 48.100 48,100 11 2% 11.2% 5,000 5,000 Europe-Africa Facility Industry Company Average E 20,400 0 2,790 0 1,800 0 24,990 0 0 0 0 24.990 0 11.2% 0.0% 3,500 0 Asia-Pacific Facility Industry Company Average E 12,000 12,000 1,573 1,573 1,536 1,536 15,109 15,109 3,391 3,391 18,500 18,500 10.4% 10.4% 3,500 3.500 Industry Company Average E 12,000 0 1,574 0 1,500 0 15,074 0 0 0 15,074 0 10.4% 0.0% 3,500 0 DECISION ENTRIES - YEAR 11 Compensation & Training Branded Production Production Facilities Distribution & Warehouse Internet Marketing Wholesale Marketing Private-Label Operations Celebrity Endorsements Corporate Citizenship Finance & Cash Flow FOOTWEAR INDUSTRY REPORT Page 1 (Scoreboard) Page 2 (EPS, ROE, Stock Price) Page 3 (Credit Rating, Image, CSRC) Page 3b (Bonus Point Awards) Page 4 Industry Overview Page 5 (Financial Statistics) Page 6 (Production Benchmarks) Page 7 (Operating Benchmarks) Page 8 (Celebrities, Price Trends) Compensation - Base Wage (% change from prior year) and Training Incentive Pay (Sper non-rojected pair) 18 of Production Workers Fringe Benefits (5 per year) Total Regular Compensation $ per year) Overtime Pay includes incentives) Total Compensation $ per year) Incentive Pay as % of Regular Comp. Best Practices Training (s per worker) Materials Cost Impact on.cumdative expenditures) Supervisory Staff (ratio of production workers to supervisor) Minimum Wage - 34.000 +1% 34,340 s 1.00 - 4.650 $ 3000 - 3,007 41.997 6,501 48,498 11.1% $ 600 per worker Sid 0.00 Sup 0.00 Minimum Wings - 20 400 0%- 0 $ 0.00 - 0 $ 0- 0 0 0 0 0 0.0% $ 0 per worker Sid 0.00 Sup 0.00 Minimum Wage - 12.000 +1%- 12,120 $ - 0.50 - 1,563 $ 1500- 1,536 15,219 3,420 18,639 10.3% 400-per worker Sid 0.00 Sup 0.00 Minimum Wage 12.000 0%- 0 $ 0.00 0 $ 0 0 0 0 0 0.0% $ 0 - per work Sid 0.00 Sup 0.00 40 - 01 Staff -20 Ind. Avg. Co. E 60,000 60,000 Minimum Salary 60.000 0% 60,000 Prior-Year Supervisory Compensation (s/year supervisor) Oto1 Staff=0 Ind. Avg. Co. E 36,000 0 Minimum Salary 36.000 0% 0 40 - 01 Staff -29 Ind. Avg Co. E 25,000 25,000 Minimum Salary - 25.000 0% 0% 25,000 0 to 1 Staff=0 Ind. Avg. Co. E 25,000 0 0 Minimum Stary - 25,000 0%. 0 Supervisory Compensation (% change in ulary benefits, and boun) Projected Workforce Productivity or per worker in V11) Number of Workers Employed (given branded production entrion) 5,000 800 0 0 0 3,479 1,150 0 0 0 SOOO Projected Y11 Performance i Investor Scoring Measures Year 11 Expectation EPS my person $228 $250 ROE (rumon 19.6% 21.0% Credit Rating A- B+ Image Rating 64 70 Change Other Measures Year 11 from Y10 Net Revenues ) 448,270 +3.6% Net Profit (0) 45,682 +14.2% Ending Cash (S) 53,933 +47,859 Cost of Labor Associated with Footwear Production 0 0 0 0 Production-Base Wages Workers Incentive Pay Fringe Benefits Overtime Pay Total Best Practices Training Expenditures Supervisory Compensationary bone) Total Cost of Production Labor $000s 27,472 3,720 2.406 5.201 38,799 480 1,200 40,479 S/pair 6.16 0.83 0.54 1.17 8.69 0.11 0.27 9.07 $/pair 0.00 0.00 0.00 0.00 0.00 0.00 0.00 0.00 5000s 13,938 1,797 1,766 3,933 21,434 460 S/pair 2.97 0.38 0.38 0.84 4.57 0.10 0.15 4.82 S000s 0 0 0 0 0 0 0 D $/pair 0.00 0.00 0.00 0.00 0.00 0.00 0.00 0.00 Per par figures nol adjusted for rojected par 0 0 0 0 0 725 22,619 Student Decisions & Reports Program, 12.11.14 OGLO BUS Software, Inc. 2020 Privacy Policy Terms of Use 10:57 PM Help - Print Save Decisions E Company - Year 11 (practice) Decisions / Reports Menu WORKFORCE COMPENSATION & TRAINING Latin America Facility Prior-Year Compensation and Productivity Data Workforce Base Wages Compensation Incentive Pay total $ per year) Fringe Benefits Total Regular Compensation Overtime Pay included incenlives) Total Compensation Incentive Pay as a % of Regular Compensation Workforce Productivity (pain per worker per year) North America Facility Industry Company Average E 34,000 34,000 4,650 4,650 3,007 3,007 41.657 41.657 6,443 6,443 48.100 48,100 11 2% 11.2% 5,000 5,000 Europe-Africa Facility Industry Company Average E 20,400 0 2,790 0 1,800 0 24,990 0 0 0 0 24.990 0 11.2% 0.0% 3,500 0 Asia-Pacific Facility Industry Company Average E 12,000 12,000 1,573 1,573 1,536 1,536 15,109 15,109 3,391 3,391 18,500 18,500 10.4% 10.4% 3,500 3.500 Industry Company Average E 12,000 0 1,574 0 1,500 0 15,074 0 0 0 15,074 0 10.4% 0.0% 3,500 0 DECISION ENTRIES - YEAR 11 Compensation & Training Branded Production Production Facilities Distribution & Warehouse Internet Marketing Wholesale Marketing Private-Label Operations Celebrity Endorsements Corporate Citizenship Finance & Cash Flow FOOTWEAR INDUSTRY REPORT Page 1 (Scoreboard) Page 2 (EPS, ROE, Stock Price) Page 3 (Credit Rating, Image, CSRC) Page 3b (Bonus Point Awards) Page 4 Industry Overview Page 5 (Financial Statistics) Page 6 (Production Benchmarks) Page 7 (Operating Benchmarks) Page 8 (Celebrities, Price Trends) Compensation - Base Wage (% change from prior year) and Training Incentive Pay (Sper non-rojected pair) 18 of Production Workers Fringe Benefits (5 per year) Total Regular Compensation $ per year) Overtime Pay includes incentives) Total Compensation $ per year) Incentive Pay as % of Regular Comp. Best Practices Training (s per worker) Materials Cost Impact on.cumdative expenditures) Supervisory Staff (ratio of production workers to supervisor) Minimum Wage - 34.000 +1% 34,340 s 1.00 - 4.650 $ 3000 - 3,007 41.997 6,501 48,498 11.1% $ 600 per worker Sid 0.00 Sup 0.00 Minimum Wings - 20 400 0%- 0 $ 0.00 - 0 $ 0- 0 0 0 0 0 0.0% $ 0 per worker Sid 0.00 Sup 0.00 Minimum Wage - 12.000 +1%- 12,120 $ - 0.50 - 1,563 $ 1500- 1,536 15,219 3,420 18,639 10.3% 400-per worker Sid 0.00 Sup 0.00 Minimum Wage 12.000 0%- 0 $ 0.00 0 $ 0 0 0 0 0 0.0% $ 0 - per work Sid 0.00 Sup 0.00 40 - 01 Staff -20 Ind. Avg. Co. E 60,000 60,000 Minimum Salary 60.000 0% 60,000 Prior-Year Supervisory Compensation (s/year supervisor) Oto1 Staff=0 Ind. Avg. Co. E 36,000 0 Minimum Salary 36.000 0% 0 40 - 01 Staff -29 Ind. Avg Co. E 25,000 25,000 Minimum Salary - 25.000 0% 0% 25,000 0 to 1 Staff=0 Ind. Avg. Co. E 25,000 0 0 Minimum Stary - 25,000 0%. 0 Supervisory Compensation (% change in ulary benefits, and boun) Projected Workforce Productivity or per worker in V11) Number of Workers Employed (given branded production entrion) 5,000 800 0 0 0 3,479 1,150 0 0 0 SOOO Projected Y11 Performance i Investor Scoring Measures Year 11 Expectation EPS my person $228 $250 ROE (rumon 19.6% 21.0% Credit Rating A- B+ Image Rating 64 70 Change Other Measures Year 11 from Y10 Net Revenues ) 448,270 +3.6% Net Profit (0) 45,682 +14.2% Ending Cash (S) 53,933 +47,859 Cost of Labor Associated with Footwear Production 0 0 0 0 Production-Base Wages Workers Incentive Pay Fringe Benefits Overtime Pay Total Best Practices Training Expenditures Supervisory Compensationary bone) Total Cost of Production Labor $000s 27,472 3,720 2.406 5.201 38,799 480 1,200 40,479 S/pair 6.16 0.83 0.54 1.17 8.69 0.11 0.27 9.07 $/pair 0.00 0.00 0.00 0.00 0.00 0.00 0.00 0.00 5000s 13,938 1,797 1,766 3,933 21,434 460 S/pair 2.97 0.38 0.38 0.84 4.57 0.10 0.15 4.82 S000s 0 0 0 0 0 0 0 D $/pair 0.00 0.00 0.00 0.00 0.00 0.00 0.00 0.00 Per par figures nol adjusted for rojected par 0 0 0 0 0 725 22,619 Student Decisions & Reports Program, 12.11.14 OGLO BUS Software, Inc. 2020 Privacy Policy Terms of Use 10:57 PM


