

Question: please help, dont quite understand the problem. I will also post the previous problem 1.4 (the one being refered to) so have a better understanding
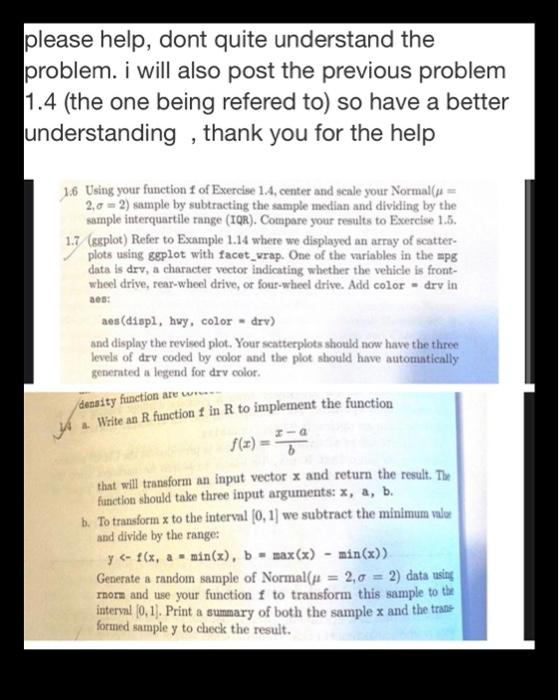
please help, dont quite understand the problem. I will also post the previous problem 1.4 (the one being refered to) so have a better understanding , thank you for the help 1.6 Using your function 1 of Exercise 1.4, center and scale your Normale = 2,0 = 2) sample by subtracting the sample median and dividing by the sample interquartile range (IQR). Compare your results to Exercise 1.5. 1.7 (splot) Refer to Example 1.14 where we displayed an array of scatter- plots using ggplot with facet_wrap. One of the variables in the mpg data is drv, a character vector indicating whether the vehicle is front- wheel drive, rear-wheel drive, or four-wheel drive. Add color - drv in aes: aes (d1ap2, hwy, color - drv) and display the revised plot. Your scatterplots should now have the three levels of dry coded by color and the plot should have automatically generated a legend for dry color. density function are w... Write an R function f in R to implement the function f(x) == that will transform an input vector x and return the result. The function should take three input arguments: x, a, b. b. To transform x to the interval (0,1) we subtract the minimum value and divide by the range: y
Step by Step Solution
There are 3 Steps involved in it

Get step-by-step solutions from verified subject matter experts