

Question: Please help. Everyone else gets it wrong. The answers filled in are definitely correct. Starbucks has a large, global supply chain that must efficiently supply

Please help. Everyone else gets it wrong. The answers filled in are definitely correct.
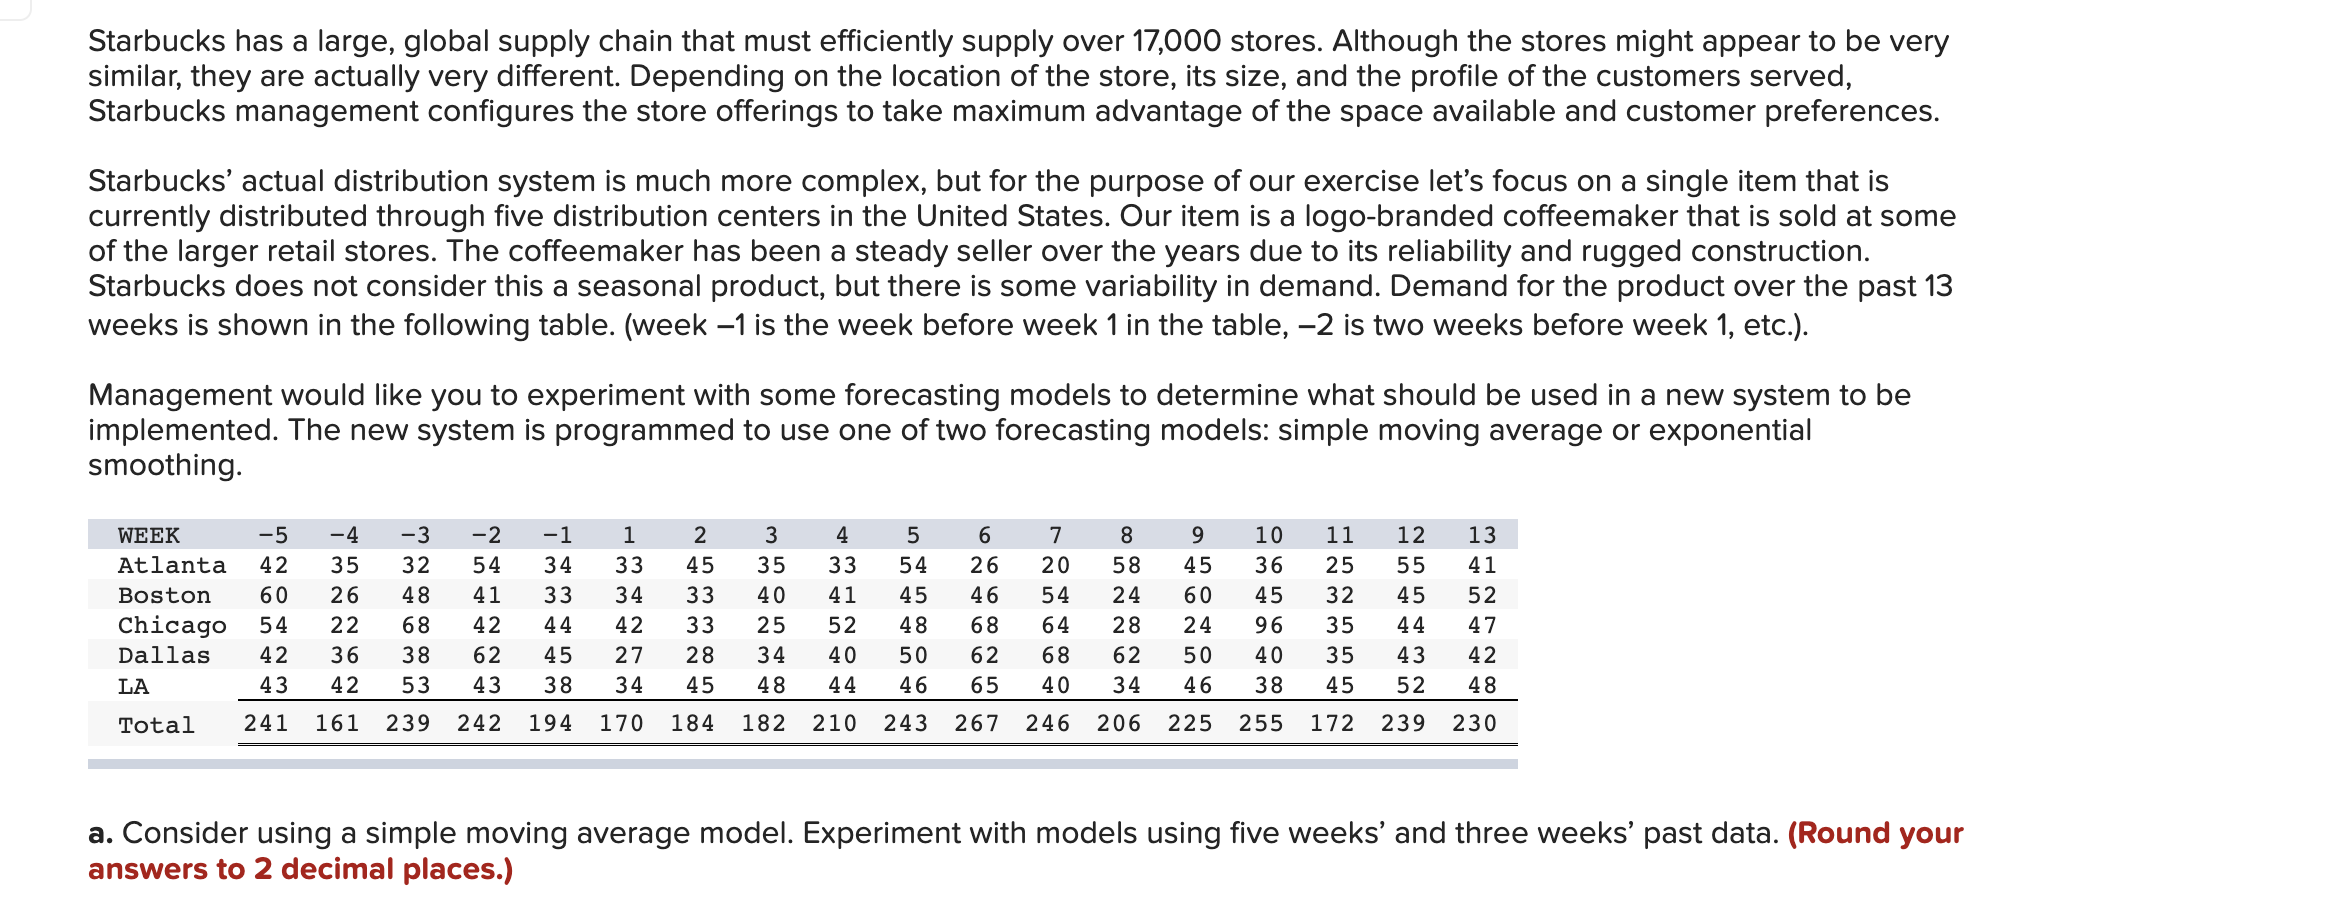
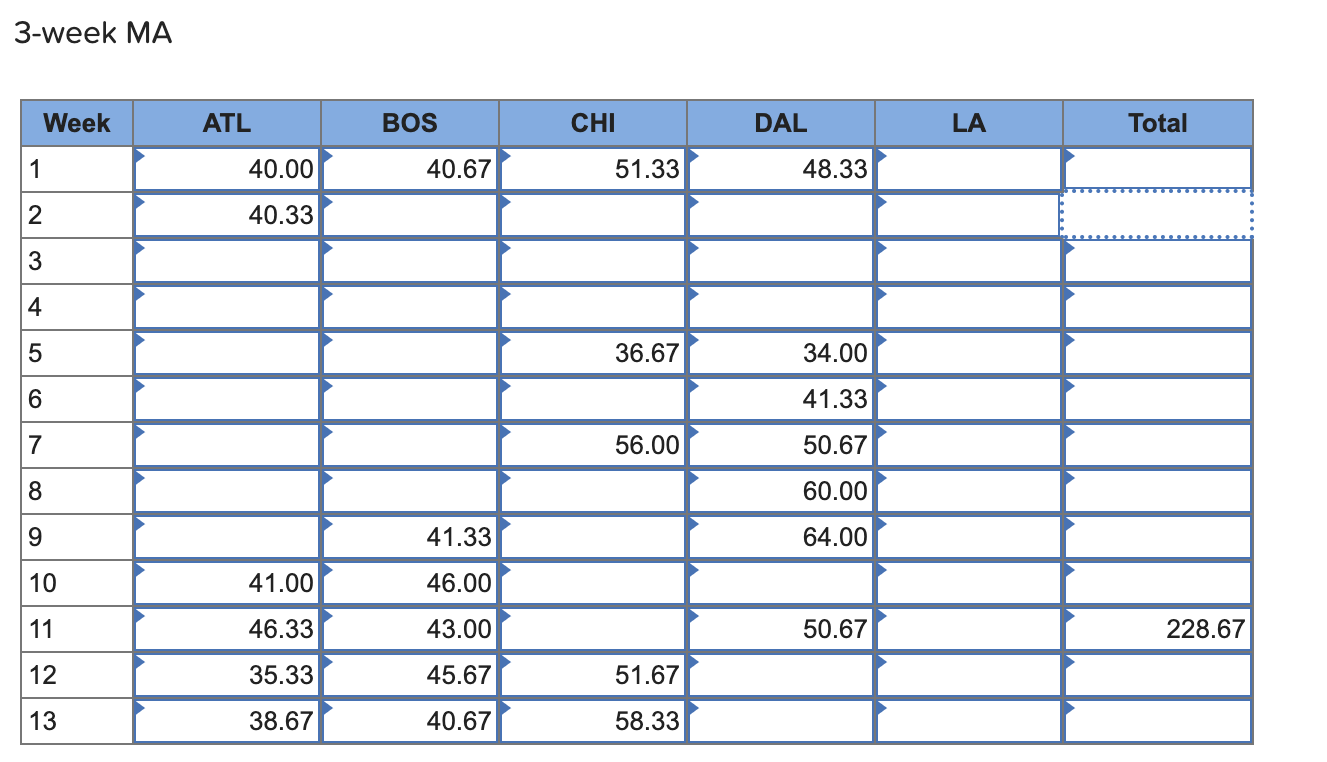

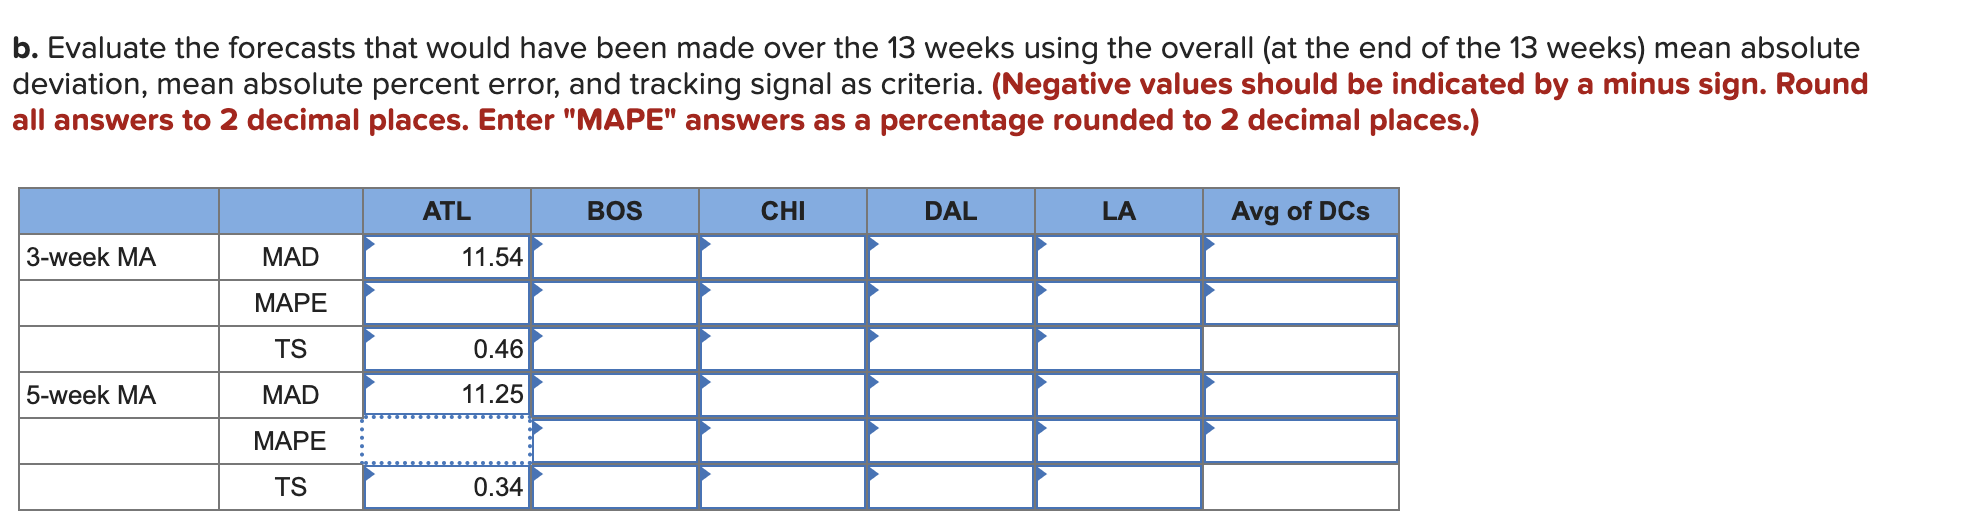
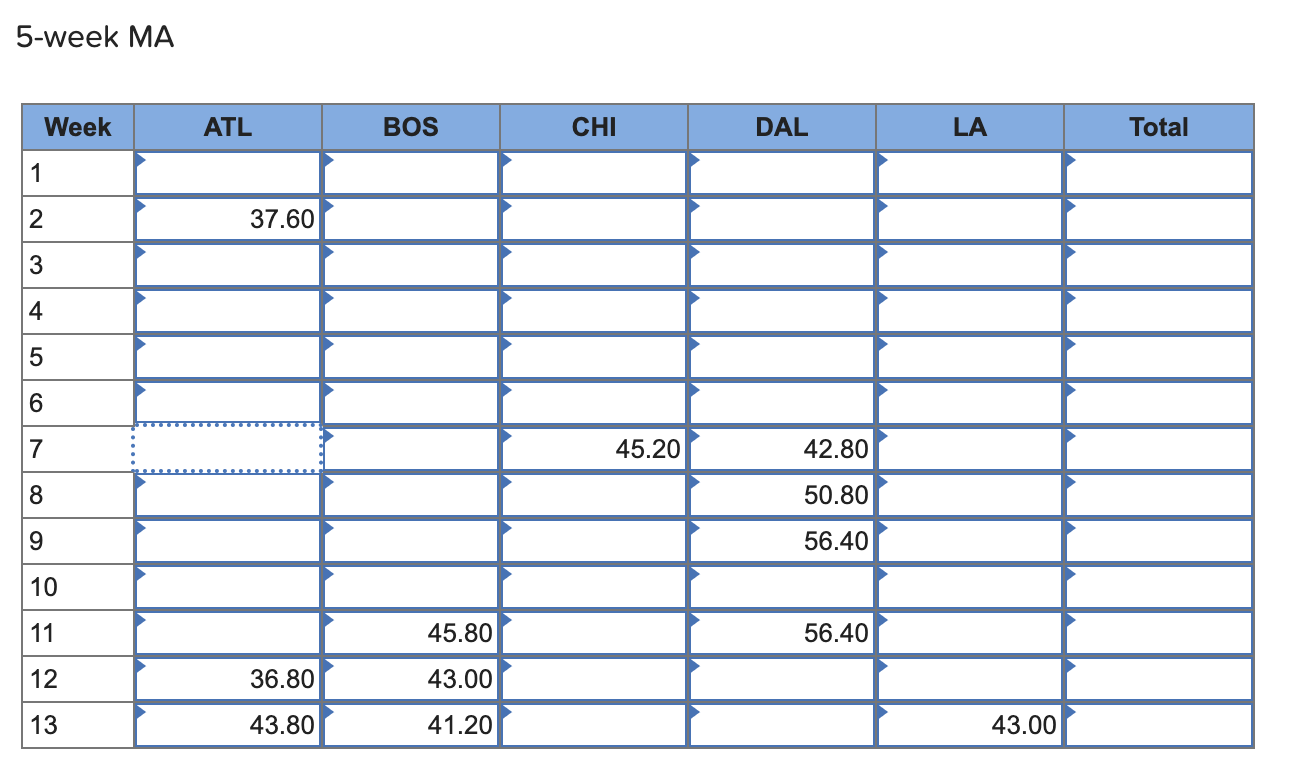
Starbucks has a large, global supply chain that must efficiently supply over 17,000 stores. Although the stores might appear to be very similar, they are actually very different. Depending on the location of the store, its size, and the prole of the customers served, Starbucks management configures the store offerings to take maximum advantage of the space available and customer preferences. Starbucks' actual distribution system is much more complex, but for the purpose of our exercise let's focus on a single item that is currently distributed through five distribution centers in the United States. Our item is a logobranded coffeemaker that is sold at some of the larger retail stores, The coffeemaker has been a steady seller over the years due to its reliability and rugged construction. Starbucks does not consider this a seasonal product, but there is some variability in demand. Demand for the product over the past 13 weeks is shown in the following table. (week -1 is the week before week 1 in the table, -2 is two weeks before week 1, etc.). Management would like you to experiment with some forecasting models to determine what should be used in a new system to be implemented. The new system is programmed to use one of two forecasting models: simple moving average or exponential smoothing. WEEK -5 -4 -3 -2 -1 1 2 3 4 5 6 7 8 9 10 11 12 13 Atlanta 42 35 32 54 34 33 45 35 33 54 26 20 58 45 36 25 55 41 Boston 60 26 48 41 33 34 33 40 41 45 46 54 24 60 45 32 45 52 Chicago 54 22 68 42 44 42 33 25 52 48 68 64 28 24 96 35 44 47 Dallas 42 36 38 62 45 27 28 34 40 50 62 68 62 50 40 35 43 42 LA 43 42 53 43 38 34 45 48 44 46 65 40 34 46 38 45 52 48 Total 241 161 239 242 194 170 184 182 210 243 267 246 206 225 255 172 239 230 a. Consider using a simple moving average model. Experiment with models using five weeks' and three weeks' past data. (Round your answers to 2 decimal places.) b. Evaluate the forecasts that would have been made over the 13 weeks using the overall (at the end of the 13 weeks) mean absolute deviation, mean absolute percent error, and tracking signal as criteria. (Negative values should be indicated by a minus sign. Round all answers to 2 decimal places. Enter "MAPE" answers as a percentage rounded to 2 decimal places.) 3-week MA MAPE TS 5-week MA MAD MAPE TS
Step by Step Solution
There are 3 Steps involved in it

Get step-by-step solutions from verified subject matter experts