

Question: Please help explain the below questions :) ng.cengage.com/static b/u i/evo/i ndex.html?deploymentld= 5991112234171050575852888863681el5 B N = 9780170389723&id=1121159432... 1} Q if CENGAGE I MINDTAP Q Search this
Please help explain the below questions :)
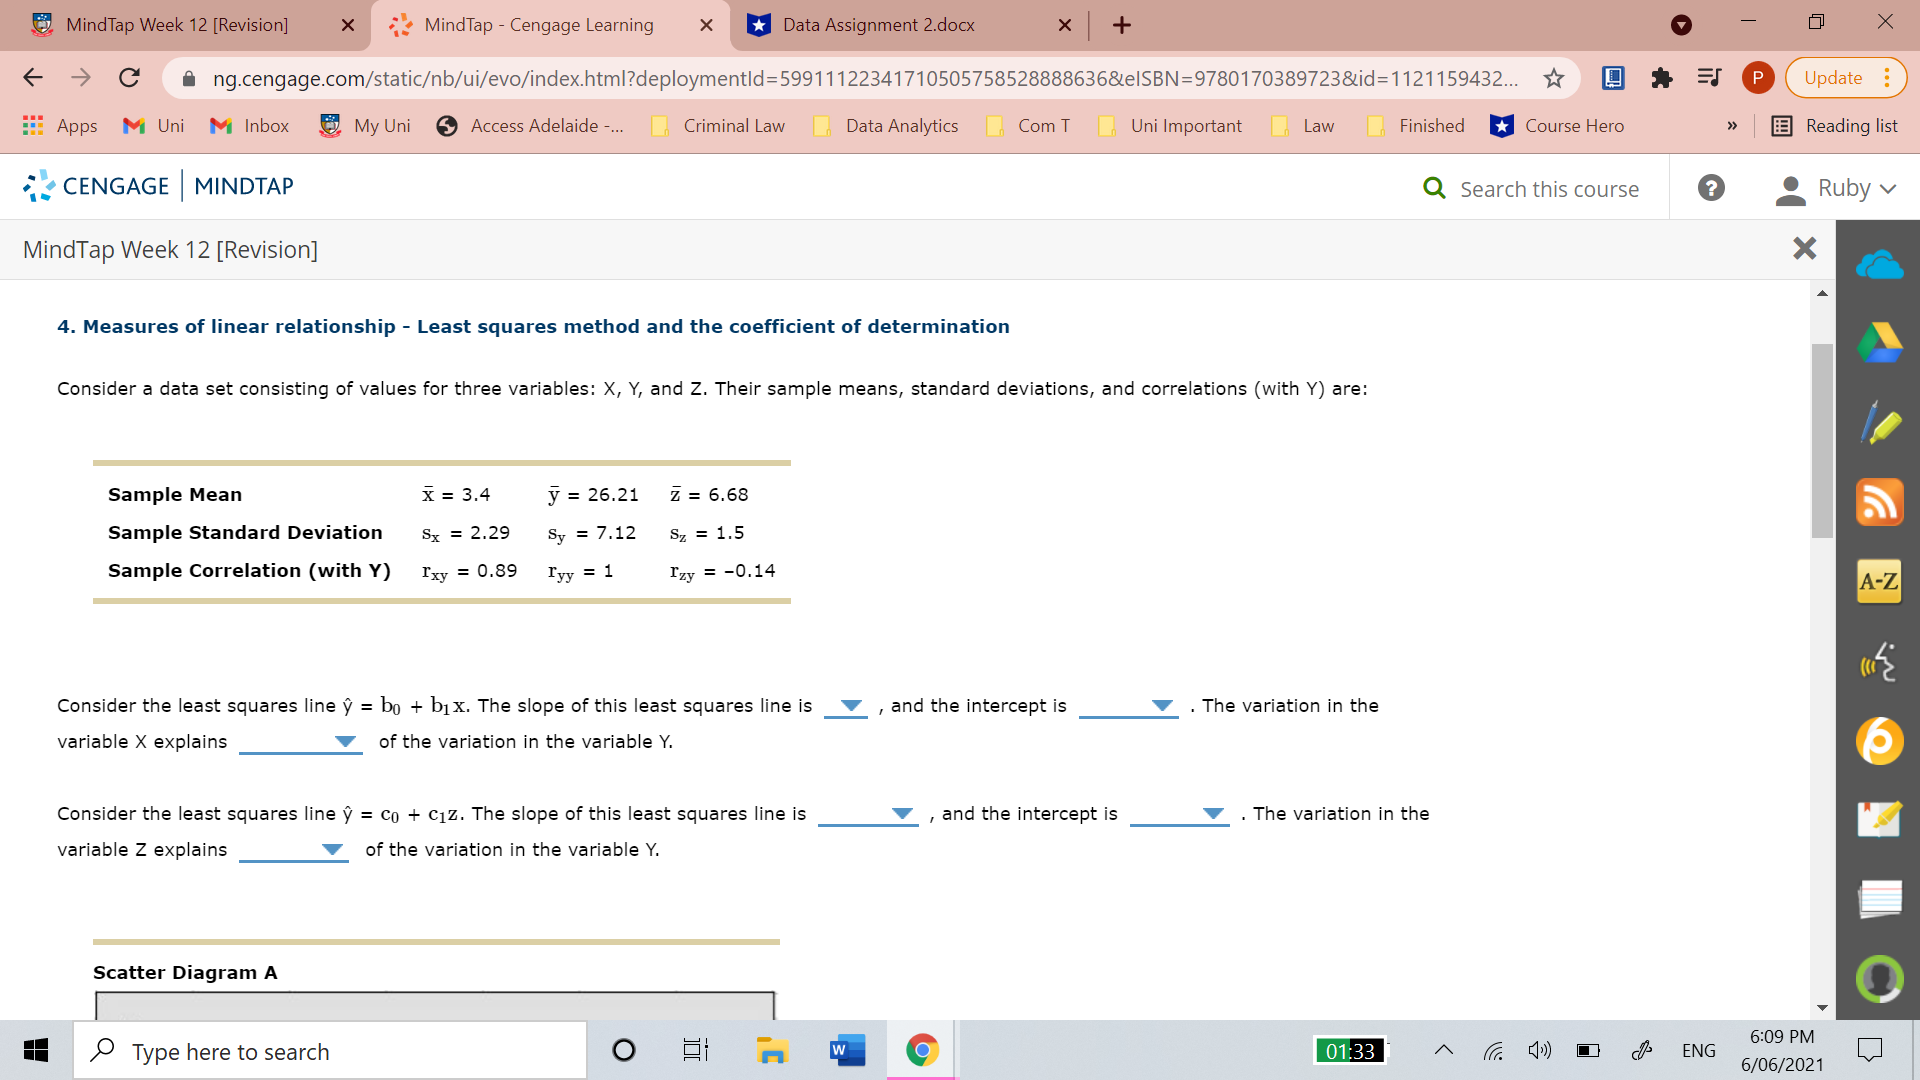
ng.cengage.com/static b/u i/evo/i ndex.html?deploymentld= 5991112234171050575852888863681el5 B N = 9780170389723&id=1121159432... 1} Q if CENGAGE I MINDTAP Q Search this course 0 ; Ruby v MindTap Week 12 [Revision] X 4. Measures of linear relationship Least squares rnelhod and the coefcient of determination Consider a data set consisting of values for three variables: X, Y, and Z. Their sample means, standard deviations, and correlations (with Y) are: Sample Mean )2 = 3.4 f = 26.21 i = 6.68 Sample Standard Deviation s, = 2.29 sy = 7.12 s, = 1.5 Sample Correlation (with Y) 1'13. = 0.89 I\" = 1 1'5, = 0.14 Consider the least squares line 9 = b0 + tax. The slope of this least squares line is V , and the intercept is V . The variation in the variable X explains V of the variation in the variable Y. Consider the least squares line 9 = on + clz. The slope of this least squares line is V , and the intercept is V . The variation in the variable Z explains V of the variation in the variable Y. Scatter Diagram A ,0 Type here to search
Step by Step Solution
There are 3 Steps involved in it

Get step-by-step solutions from verified subject matter experts