

Question: please help . feb.23 EXHIBIT 17.11 Benchmark Ratios, will be used to compare calculated ratio of Q-17-17 to Q17-22 2017 Playground Equipment Industry Average Ratios
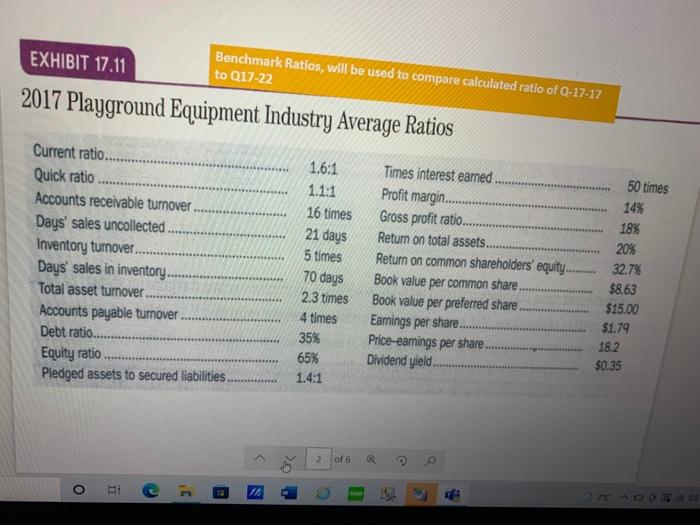
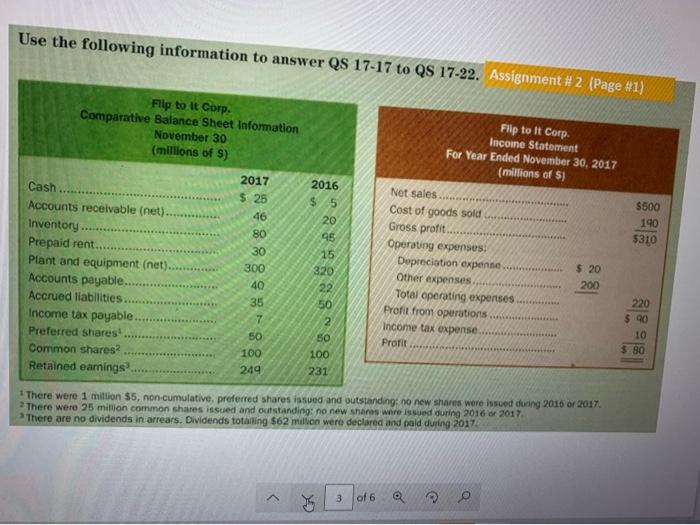
EXHIBIT 17.11 Benchmark Ratios, will be used to compare calculated ratio of Q-17-17 to Q17-22 2017 Playground Equipment Industry Average Ratios 50 times Current ratio. Quick ratio Accounts receivable turnover Days' sales uncollected. Inventory tumover... Days' sales in inventory Total asset tumover Accounts payable turnover Debt ratio.......... Equity ratio Pledged assets to secured liabilities 1.6:1 1.1:1 16 times 21 days 5 times 70 days 2.3 times 4 times 35% 65% 1.4:1 Times interest earned Profit margin........ Gross profit ratio. Return on total assets. Return on common shareholders' equity. Book value per common share. Book value per preferred share Earnings per share......... Price-earings per share. Dividend yield 14% 18% 20% 32.7% $8.63 $15.00 $1.79 18.2 $0.35 *** > of 6 O i I 10 - Use the following information to answer QS 17-17 to QS 17-22. Assignment #2 (Page #1) Flip to It Corp. Comparative Balance Sheet Information November 30 (millions of S) 2017 $ 25 46 Cash Accounts receivable (net). Inventory Prepaid rent... Plant and equipment (net)............. Accounts payable... Accrued liabilities Income tax payable. Preferred shares! Common shares Retained earnings $500 190 $310 80 30 300 40 Flip to It Corp Income Statement For Year Ended November 30, 2017 (millions of $j Net sales. Cost of goods sold Gross profit.. Operating expenses Depreciation expense........... $ 20 Other expenses 200 Total operating expenses Profit from operations Income tax expense Profit *** 0878888":85 35 7 50 100 220 $.90 10 5 80 249 1 There were 1 million $5, non-cumulative, preferred shares issued and outstanding: no new shares were issued during 2016 or 2017 There were 25 million common shares issued and outstanding: no new shares were issued during 2016 2017 There are no dividends in arrears. Dividends totaling $62 million were declared and paid during 2017 A 3 of 6 I EXHIBIT 17.11 Benchmark Ratios, will be used to compare calculated ratio of Q-17-17 to Q17-22 2017 Playground Equipment Industry Average Ratios 50 times Current ratio. Quick ratio Accounts receivable turnover Days' sales uncollected. Inventory tumover... Days' sales in inventory Total asset tumover Accounts payable turnover Debt ratio.......... Equity ratio Pledged assets to secured liabilities 1.6:1 1.1:1 16 times 21 days 5 times 70 days 2.3 times 4 times 35% 65% 1.4:1 Times interest earned Profit margin........ Gross profit ratio. Return on total assets. Return on common shareholders' equity. Book value per common share. Book value per preferred share Earnings per share......... Price-earings per share. Dividend yield 14% 18% 20% 32.7% $8.63 $15.00 $1.79 18.2 $0.35 *** > of 6 O i I 10 - Use the following information to answer QS 17-17 to QS 17-22. Assignment #2 (Page #1) Flip to It Corp. Comparative Balance Sheet Information November 30 (millions of S) 2017 $ 25 46 Cash Accounts receivable (net). Inventory Prepaid rent... Plant and equipment (net)............. Accounts payable... Accrued liabilities Income tax payable. Preferred shares! Common shares Retained earnings $500 190 $310 80 30 300 40 Flip to It Corp Income Statement For Year Ended November 30, 2017 (millions of $j Net sales. Cost of goods sold Gross profit.. Operating expenses Depreciation expense........... $ 20 Other expenses 200 Total operating expenses Profit from operations Income tax expense Profit *** 0878888":85 35 7 50 100 220 $.90 10 5 80 249 1 There were 1 million $5, non-cumulative, preferred shares issued and outstanding: no new shares were issued during 2016 or 2017 There were 25 million common shares issued and outstanding: no new shares were issued during 2016 2017 There are no dividends in arrears. Dividends totaling $62 million were declared and paid during 2017 A 3 of 6
Step by Step Solution
There are 3 Steps involved in it

Get step-by-step solutions from verified subject matter experts