

Question: Please help fill out the excel sheet B Excel Sheet A) Aggregate Plan Excel Sheet B) Fill out the excel sheet for overtime, please D
Please help fill out the excel sheet B
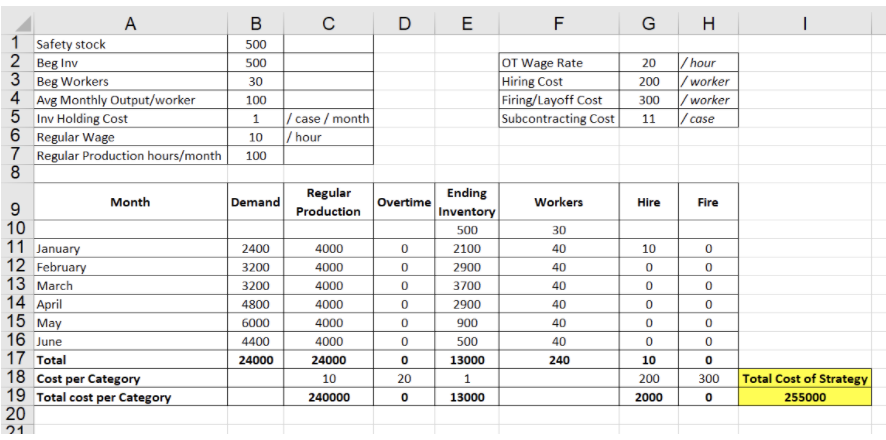
Excel Sheet A) Aggregate Plan
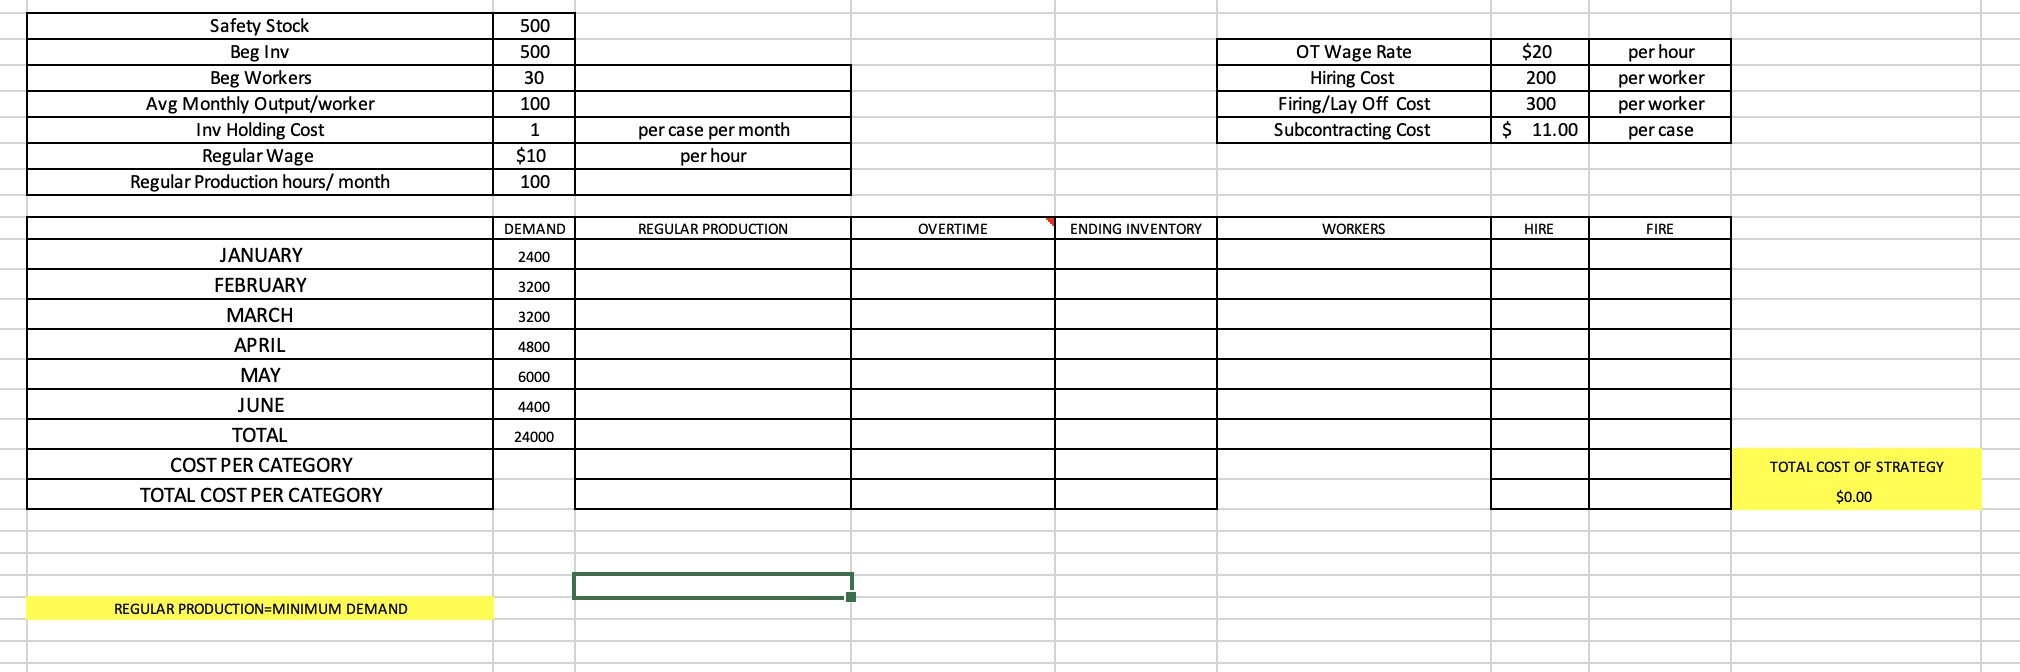
Excel Sheet B) Fill out the excel sheet for overtime, please
Step by Step Solution
There are 3 Steps involved in it
1 Expert Approved Answer
Step: 1 Unlock

Question Has Been Solved by an Expert!
Get step-by-step solutions from verified subject matter experts
Step: 2 Unlock
Step: 3 Unlock