

Question: PLEASE HELP!! First part is the observation sheet, and i need help with questions 1-3! thank uu Molar mass of kl: molarisy of S3O52 (ffom
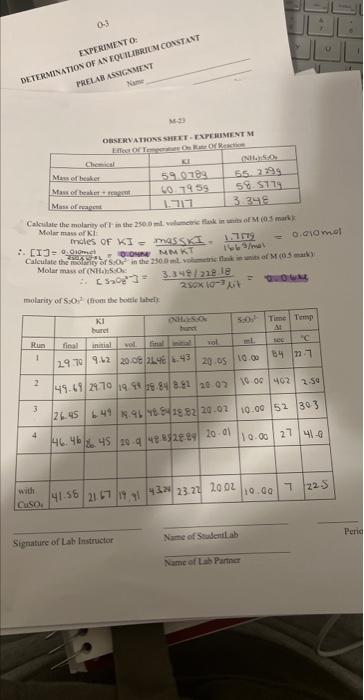
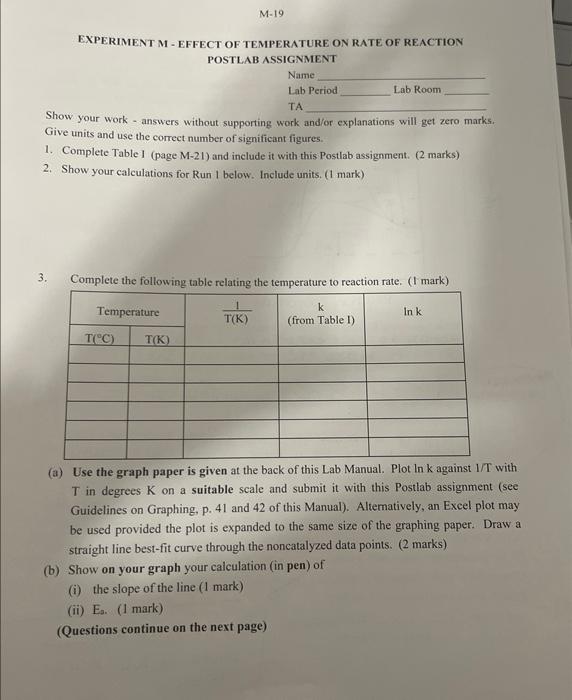
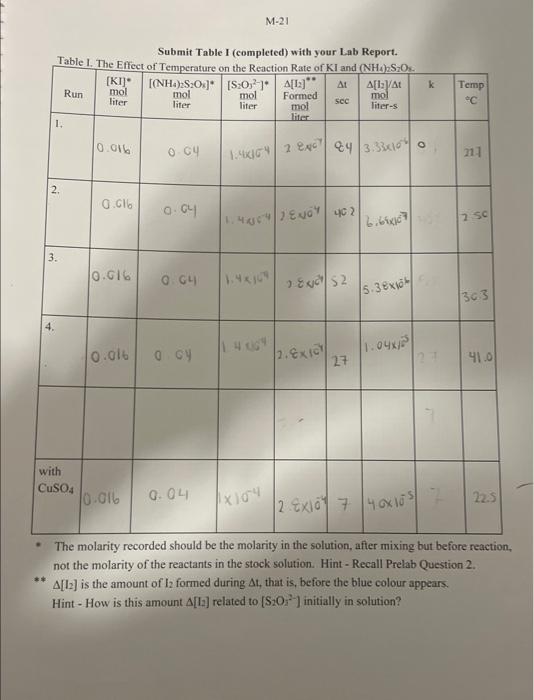
Molar mass of kl: molarisy of S3O52 (ffom the botele lahels: Signatuec of Lab Instructor EXPERIMENT M - EFFECT OF TEMPERATURE ON RATE OF REACTION POSTLAB ASSIGNMENT Name Lab Period Lab Room TA Show your work - answers without supporting work and/or explanations will get zero marks. Give units and use the correct number of significant figures. 1. Complete Table I (page M-21) and include it with this Postlab assignment. (2 marks) 2. Show your calculations for Run 1 below. Include units. ( 1 mark) 3. Complete the following table relating the temperature to reaction rate. ( 1 mark) (a) Use the graph paper is given at the back of this Lab Manual. Plot ln k against 1/T with. T in degrees K on a suitable scale and submit it with this Postlab assignment (see Guidelines on Graphing, p. 41 and 42 of this Manual). Alternatively, an Excel plot may be used provided the plot is expanded to the same size of the graphing paper. Draw a straight line best-fit curve through the noncatalyzed data points. ( 2 marks) (b) Show on your graph your calculation (in pen) of (i) the slope of the line ( 1 mark) (ii) Es. (1 mark) (Questions continue on the next page) The molarity recorded should be the molarity in the solution, after mixing but before reaction, not the molarity of the reactants in the stock solution. Hint - Recall Prelab Question 2. [I2] is the amount of I2 formed during t, that is, before the blue colour appears. Hint - How is this amount [[2] related to [S2O22] initially in solution? Molar mass of kl: molarisy of S3O52 (ffom the botele lahels: Signatuec of Lab Instructor EXPERIMENT M - EFFECT OF TEMPERATURE ON RATE OF REACTION POSTLAB ASSIGNMENT Name Lab Period Lab Room TA Show your work - answers without supporting work and/or explanations will get zero marks. Give units and use the correct number of significant figures. 1. Complete Table I (page M-21) and include it with this Postlab assignment. (2 marks) 2. Show your calculations for Run 1 below. Include units. ( 1 mark) 3. Complete the following table relating the temperature to reaction rate. ( 1 mark) (a) Use the graph paper is given at the back of this Lab Manual. Plot ln k against 1/T with. T in degrees K on a suitable scale and submit it with this Postlab assignment (see Guidelines on Graphing, p. 41 and 42 of this Manual). Alternatively, an Excel plot may be used provided the plot is expanded to the same size of the graphing paper. Draw a straight line best-fit curve through the noncatalyzed data points. ( 2 marks) (b) Show on your graph your calculation (in pen) of (i) the slope of the line ( 1 mark) (ii) Es. (1 mark) (Questions continue on the next page) The molarity recorded should be the molarity in the solution, after mixing but before reaction, not the molarity of the reactants in the stock solution. Hint - Recall Prelab Question 2. [I2] is the amount of I2 formed during t, that is, before the blue colour appears. Hint - How is this amount [[2] related to [S2O22] initially in solution
Step by Step Solution
There are 3 Steps involved in it

Get step-by-step solutions from verified subject matter experts