

Question: please help For the accompanying data set, (a) draw a scatter diagram of the data, (b) compute the correlation coefficient, and (c) determine whether there
please help
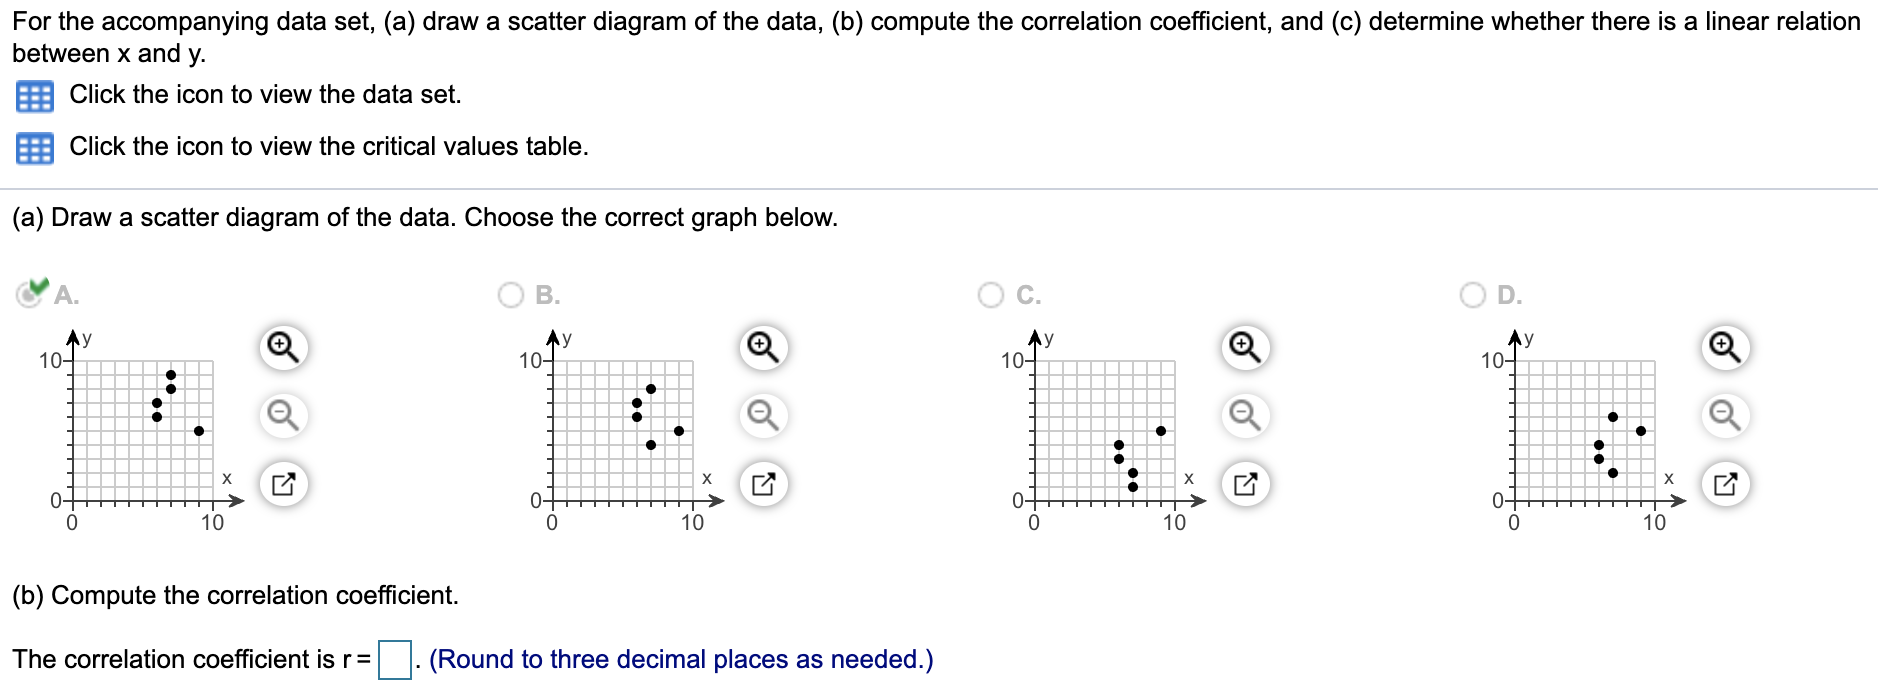
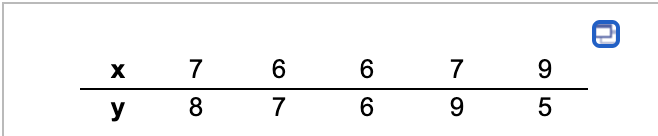
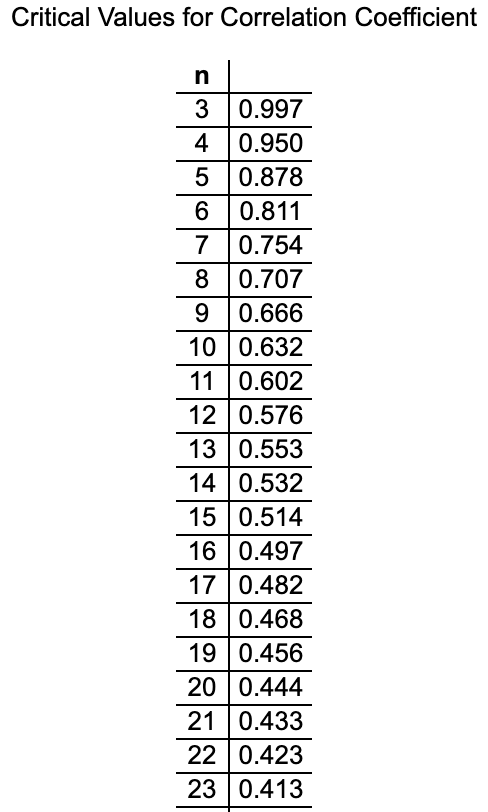
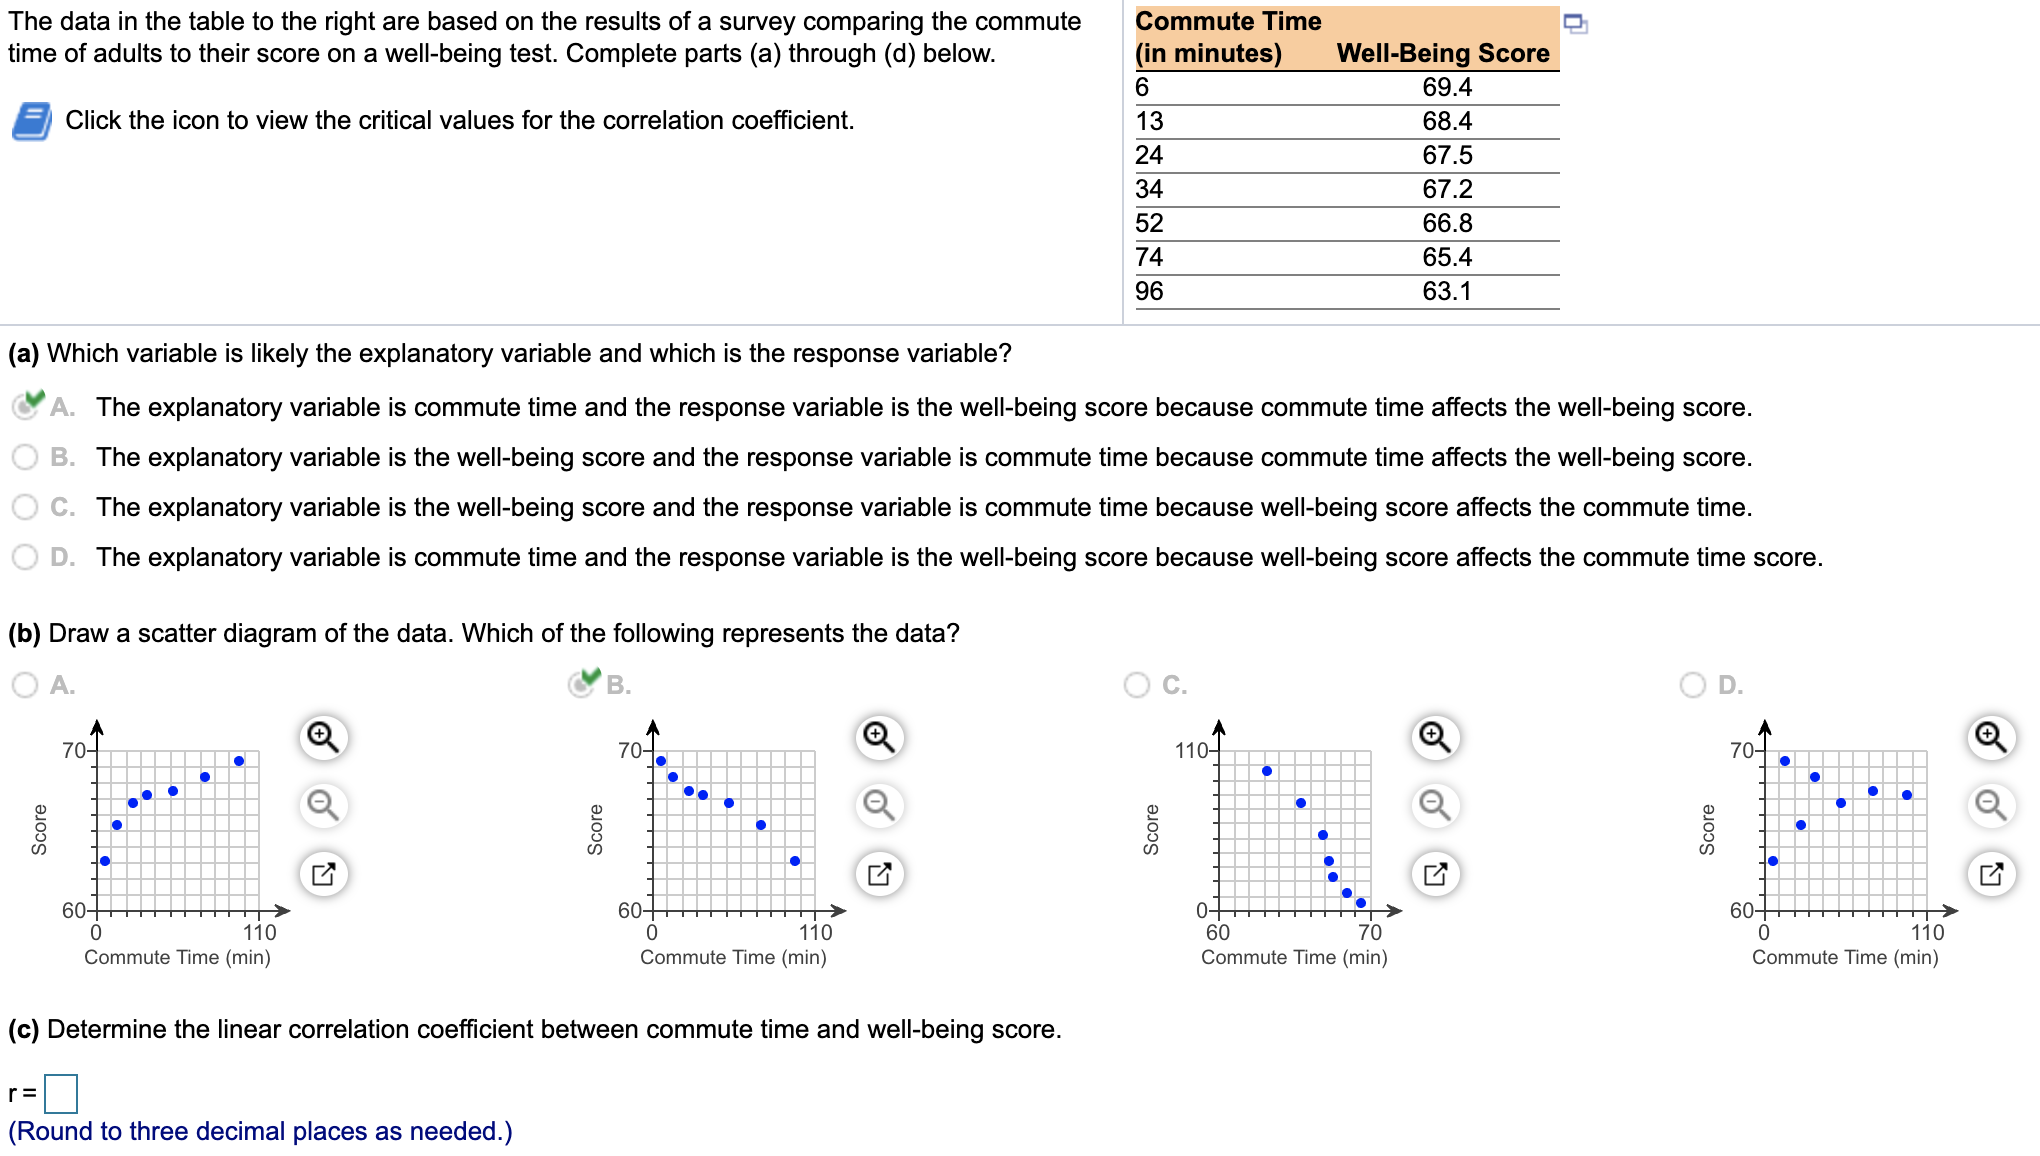
For the accompanying data set, (a) draw a scatter diagram of the data, (b) compute the correlation coefficient, and (c) determine whether there is a linear relation between x and y. Click the icon to view the data set. Click the icon to view the critical values table. (a) Draw a scatter diagram of the data. Choose the correct graph below. CA. O B. O C. O D. 10 7y 10 Ty 10 7y X X 07 X X 10 10 10 10 (b) Compute the correlation coefficient. The correlation coefficient is r= . (Round to three decimal places as needed.)\f\fThe data in the table to the right are based on the results of a survey comparing the commute Commute Time Ch time of adults to their score on a well-being test. Complete parts (a) through (d) below. (in minutes) Well-Being Score 6 69.4 5 Click the icon to view the critical values for the correlation coeicient. 13 68.4 24 67.5 34 67.2 52 66.8 74 65.4 96 63.1 (a) Which variable is likely the explanatory variable and which is the response variable? N A. The explanatory variable is commute time and the response variable is the wellbeing score because commute time affects the well-being score. B. The explanatory variable is the well-being score and the response variable is commute time because commute time affects the well-being score. C. The explanatory variable is the well-being score and the response variable is commute time because wellbeing score affects the commute time. D. The explanatory variable is commute time and the response variable is the wellbeing score because wellbeing score affects the commute time score. (b) Draw a scatter diagram of the data. Which of the following represents the data? A. ~"B. c. D. Score Score Score Score 0 11 0 0 110 60 7O 0 110 Commute Time (min) Commute Time (min) Commute Time (min) Commute Time (min) (c) Determine the linear correlation coefcient between commute time and well-being score. r=E (Round to three decimal places as needed.)
Step by Step Solution
There are 3 Steps involved in it

Get step-by-step solutions from verified subject matter experts