

Question: solve the questions 4.1.19 Question Help For the accompanying data set, (a) draw a scatter diagram of the data, (b) compute the correlation coefficient, and
solve the questions
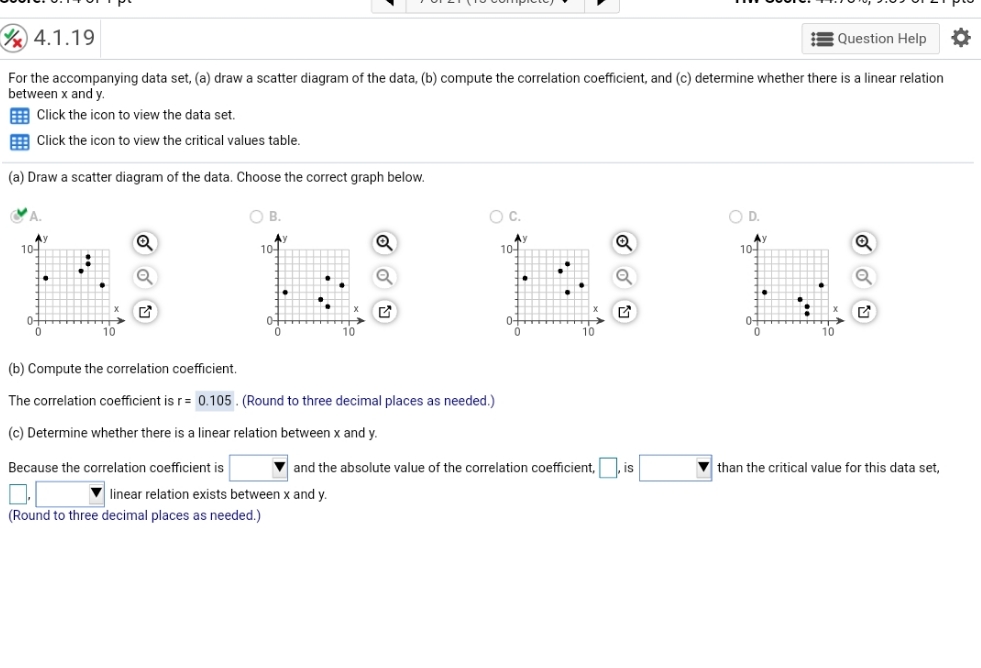
4.1.19 Question Help For the accompanying data set, (a) draw a scatter diagram of the data, (b) compute the correlation coefficient, and (c) determine whether there is a linear relation between x and y. Click the icon to view the data set. Click the icon to view the critical values table. (a) Draw a scatter diagram of the data. Choose the correct graph below. O B. O C. O D. 10 10-7 10- 10- 10 10 (b) Compute the correlation coefficient. The correlation coefficient is r= 0.105 . (Round to three decimal places as needed.) (c) Determine whether there is a linear relation between x and y. Because the correlation coefficient is and the absolute value of the correlation coefficient, , is than the critical value for this data set, linear relation exists between x and y. (Round to three decimal places as needed.)
Step by Step Solution
There are 3 Steps involved in it

Get step-by-step solutions from verified subject matter experts