

Question: Please help graph both tables using Excel. The data is already given; tables are completed, but I have difficulty graphing. Note for both graphs: Read
Please help graph both tables using Excel. The data is already given; tables are completed, but I have difficulty graphing.
Note for both graphs: Read the instructions above each table for the proper graph.
Make sure that axes are labeled appropriately (with units!), and indicate the normal extracellular concentration of the given ion on each graph:
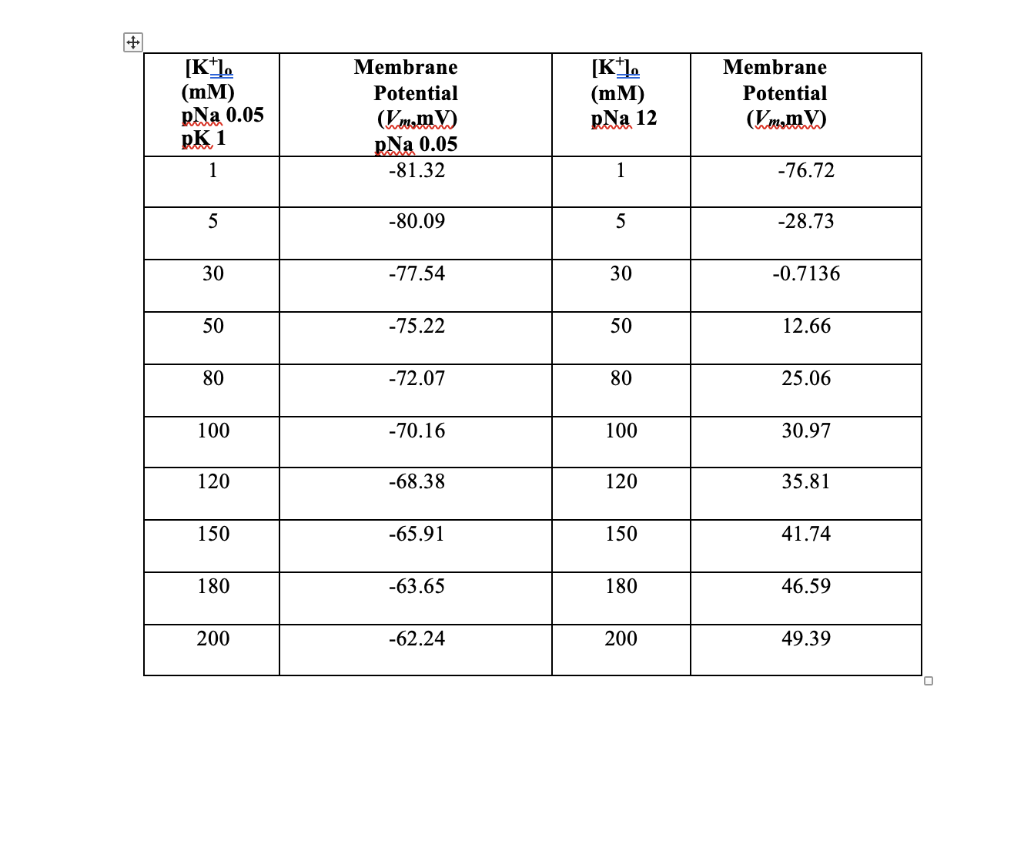
Graph for table A is: Vm vs. [Na+]o
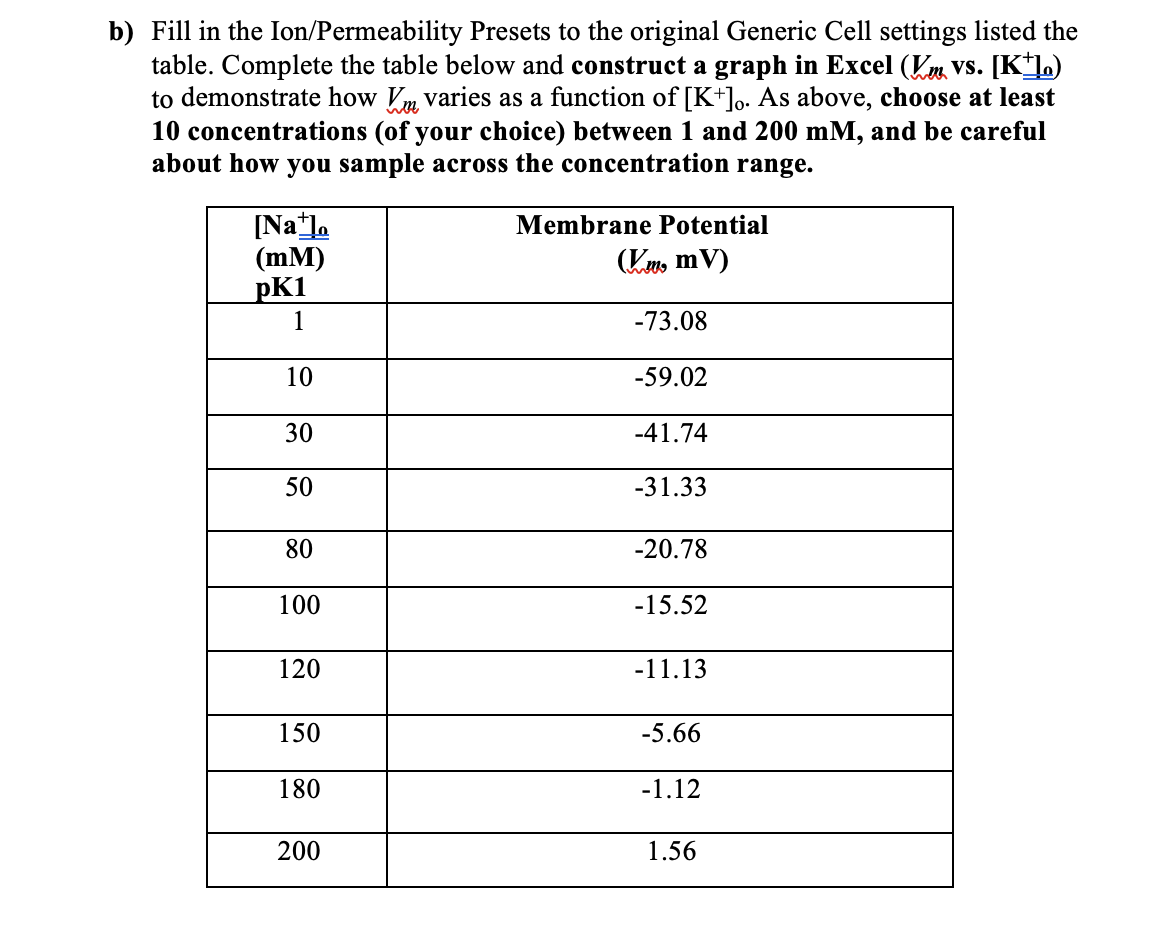
Graph for table B is: Vm vs. [K+]o
Thank you, I really appreciate your help.
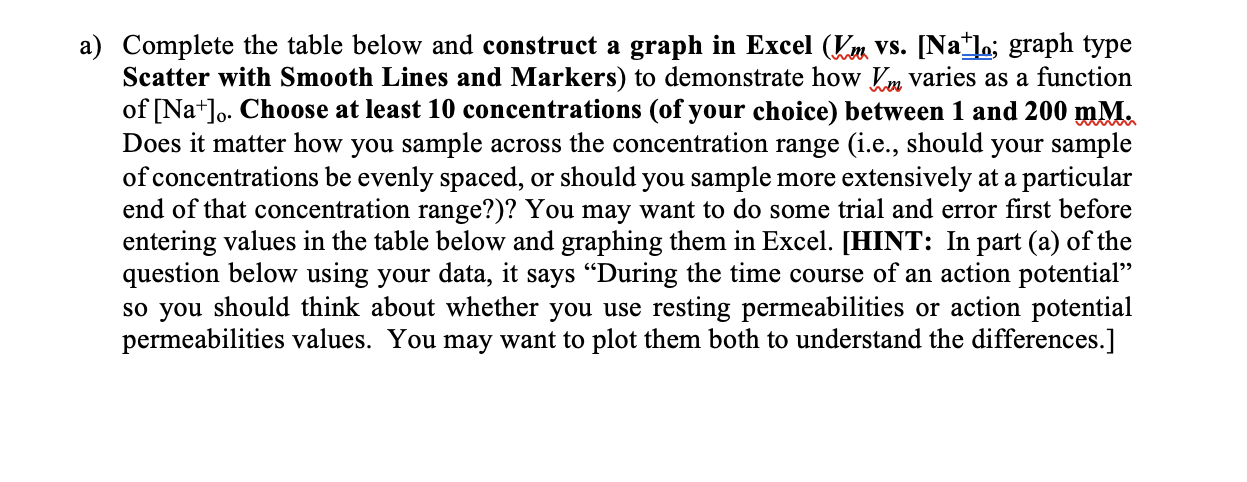
a) Complete the table below and construct a graph in Excel ( Vmvs.[Na=+l; graph type Scatter with Smooth Lines and Markers) to demonstrate how Vm varies as a function of [Na+]0. Choose at least 10 concentrations (of your choice) between 1 and 200mM. Does it matter how you sample across the concentration range (i.e., should your sample of concentrations be evenly spaced, or should you sample more extensively at a particular end of that concentration range?)? You may want to do some trial and error first before entering values in the table below and graphing them in Excel. [HINT: In part (a) of the question below using your data, it says "During the time course of an action potential" so you should think about whether you use resting permeabilities or action potential permeabilities values. You may want to plot them both to understand the differences.] Fill in the Ion/Permeability Presets to the original Generic Cell settings listed the to demonstrate how Vog varies as a function of [K+]0. As above, choose at least 10 concentrations (of your choice) between 1 and 200mM, and be careful about how you sample across the concentration range. a) Complete the table below and construct a graph in Excel ( Vmvs.[Na=+l; graph type Scatter with Smooth Lines and Markers) to demonstrate how Vm varies as a function of [Na+]0. Choose at least 10 concentrations (of your choice) between 1 and 200mM. Does it matter how you sample across the concentration range (i.e., should your sample of concentrations be evenly spaced, or should you sample more extensively at a particular end of that concentration range?)? You may want to do some trial and error first before entering values in the table below and graphing them in Excel. [HINT: In part (a) of the question below using your data, it says "During the time course of an action potential" so you should think about whether you use resting permeabilities or action potential permeabilities values. You may want to plot them both to understand the differences.] Fill in the Ion/Permeability Presets to the original Generic Cell settings listed the to demonstrate how Vog varies as a function of [K+]0. As above, choose at least 10 concentrations (of your choice) between 1 and 200mM, and be careful about how you sample across the concentration range
Step by Step Solution
There are 3 Steps involved in it

Get step-by-step solutions from verified subject matter experts