

Question: please help! have under 24 hours! the questions as as one as they correspond with each other! thank you! 1. Using the calibration graph and
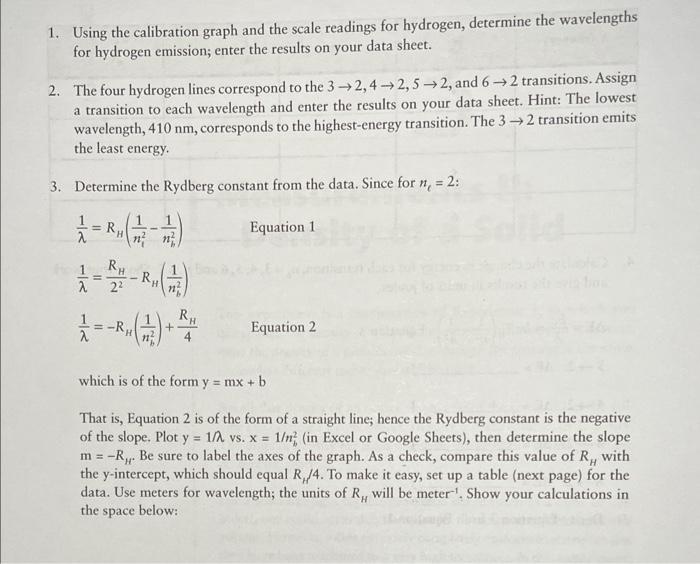
1. Using the calibration graph and the scale readings for hydrogen, determine the wavelengths for hydrogen emission; enter the results on your data sheet. 2. The four hydrogen lines correspond to the 32,42,52, and 62 transitions. Assign a transition to each wavelength and enter the results on your data sheet. Hint: The lowest wavelength, 410nm, corresponds to the highest-energy transition. The 32 transition emits the least energy. 3. Determine the Rydberg constant from the data. Since for n=2 : 1=RH(ni21nh21)1=22RHRH(nb21)1=RH(nb21)+4RH Equation 1 which is of the form y=mx+b That is, Equation 2 is of the form of a straight line; hence the Rydberg constant is the negative of the slope. Plot y=1/ vs. x=1b2 (in Excel or Google Sheets), then determine the slope m=RH. Be sure to label the axes of the graph. As a check, compare this value of RH with the y-intercept, which should equal RH/4. To make it easy, set up a table (next page) for the data. Use meters for wavelength; the units of RH will be meter 1. Show your calculations in the space below
Step by Step Solution
There are 3 Steps involved in it

Get step-by-step solutions from verified subject matter experts