

Question: Please help. I am trying to upload the CSV file but I do not know how. I really need help so for tutors if you
Please help. I am trying to upload the CSV file but I do not know how. I really need help so for tutors if you can provide your email or let me know how I can submit CSV file that would be great. This assignment is interesting because there are more freedoms in terms up different variables to choose, but we need to show all 9 methods in last Page. I would appreciate if you can help
The dataset "OriginalFramingham.csv" is a subset of one of the most famous longitudinal, and still ongoing, cardiovascular studies.
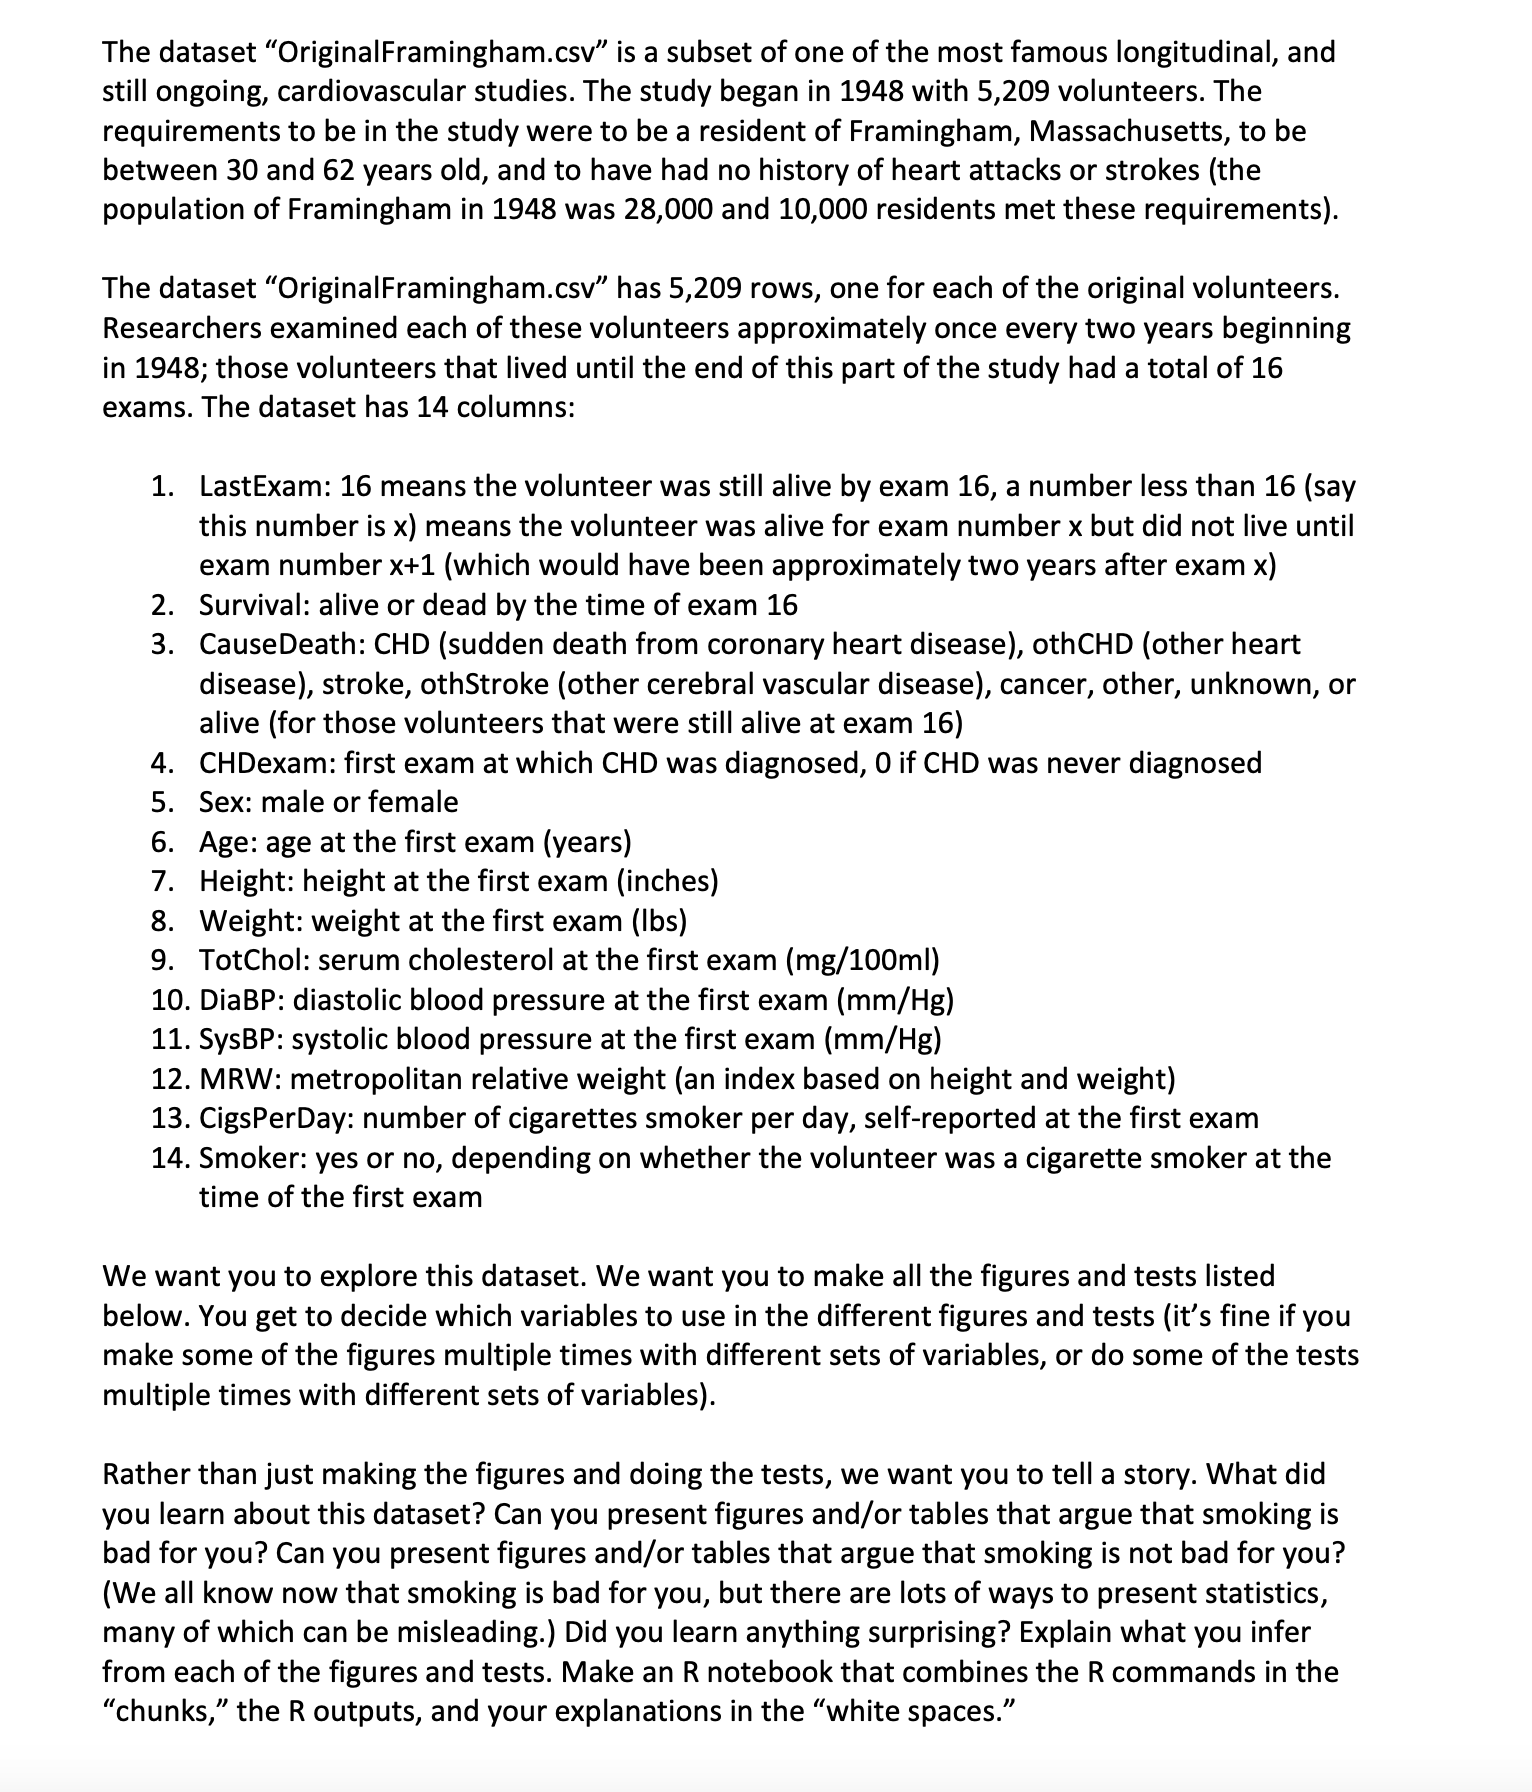
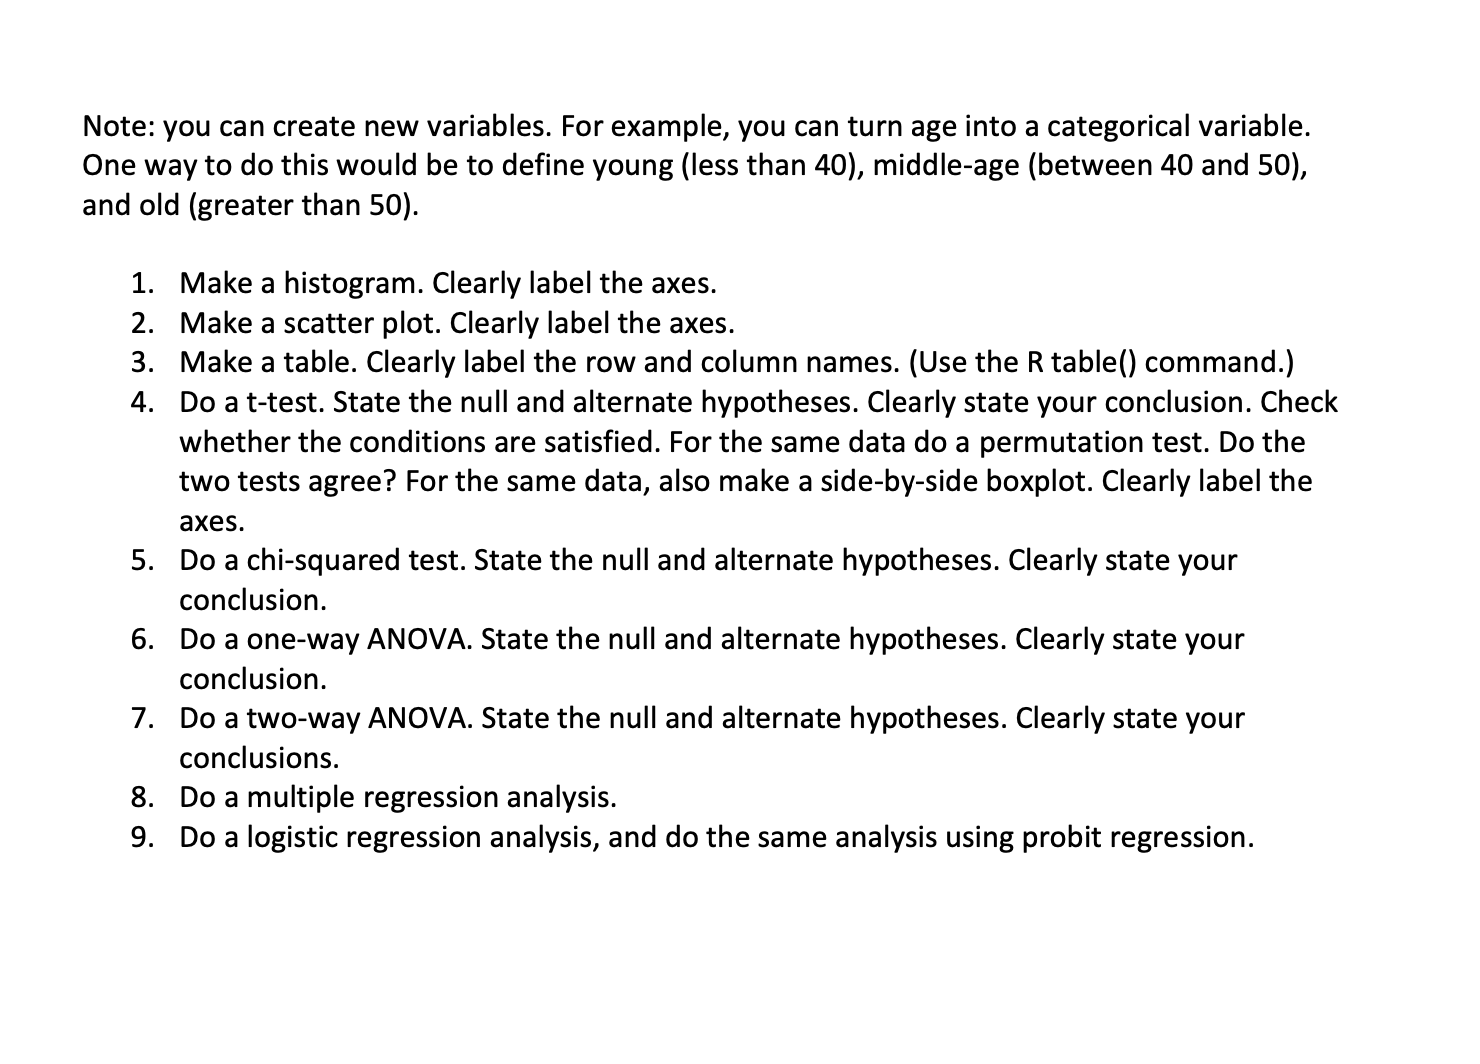
The dataset \"OriginalFramingham.csv" is a subset of one of the most famous longitudinal, and still ongoing, cardiovascular studies. The study began in 1948 with 5,209 volunteers. The requirements to be in the study were to be a resident of Framingham, Massachusetts, to be between 30 and 62 years old, and to have had no history of heart attacks or strokes (the population of Framingham in 1948 was 28,000 and 10,000 residents met these requirements). The dataset "OriginalFramingham.csv\" has 5,209 rows, one for each of the original volunteers. Researchers examined each of these volunteers approximately once every two years beginning in 1948; those volunteers that lived until the end of this part of the study had a total of 16 exams. The dataset has 14 columns: 1. LastExam: 16 means the volunteer was still alive by exam 16, a number less than 16 (say this number is x) means the volunteer was alive for exam number x but did not live until exam number x+1 (which would have been approximately two years after exam x) 2. Survival: alive or dead by the time of exam 16 3. CauseDeath: CHD (sudden death from coronary heart disease), othCHD (other heart disease), stroke, othStroke (other cerebral vascular disease), cancer, other, unknown, or alive (for those volunteers that were still alive at exam 16) 4 CHDexam: first exam at which CHD was diagnosed, 0 if CHD was never diagnosed 5. Sex: male orfemale 6. Age: age at the first exam (years) 7 Height: height at the first exam (inches) 8 Weight: weight at the first exam (lbs) 9. TotChol: serum cholesterol at the first exam (mg/100ml) 10. DiaBP: diastolic blood pressure at the first exam (mm/Hg) 11. SysBP: systolic blood pressure at the first exam (mm/Hg) 12. MRW: metropolitan relative weight (an index based on height and weight) 13. CigsPerDay: number of cigarettes smoker per day, selfreported at the first exam 14. Smoker: yes or no, depending on whether the volunteer was a cigarette smoker at the time of the first exam We want you to explore this dataset. We want you to make all the figures and tests listed below. You get to decide which variables to use in the different figures and tests (it's fine if you make some of the figures multiple times with different sets of variables, or do some of the tests multiple times with different sets of variables). Rather than just making the figures and doing the tests, we want you to tell a story. What did you learn about this dataset? Can you present figures and/or tables that argue that smoking is bad for you? Can you present figures and/or tables that argue that smoking is not bad for you? (We all know now that smoking is bad for you, but there are lots of ways to present statistics, many of which can be misleading.) Did you learn anything surprising? Explain what you infer from each of the figures and tests. Make an R notebook that combines the R commands in the \"chunks,\" the R outputs, and your explanations in the \"white spaces.\" Note: you can create new variables. For example, you can turn age into a categorical variable. One way to do this would be to define young (less than 40), middle-age (between 40 and 50), and old (greater than 50). PWP!' Make a histogram. Clearly label the axes. Make a scatter plot. Clearly label the axes. Make a table. Clearly label the row and column names. (Use the R table() command.) Do a ttest. State the null and alternate hypotheses. Clearly state your conclusion. Check whether the conditions are satisfied. For the same data do a permutation test. Do the two tests agree? For the same data, also make a side-by-side boxplot. Clearly label the axes. Do a chisquared test. State the null and alternate hypotheses. Clearly state your conclusion. Do a one-way ANOVA. State the null and alternate hypotheses. Clearly state your conclusion. Do a two-way ANOVA. State the null and alternate hypotheses. Clearly state your conclusions. Do a multiple regression analysis. Do a logistic regression analysis, and do the same analysis using probit regression
Step by Step Solution
There are 3 Steps involved in it

Get step-by-step solutions from verified subject matter experts