

Question: Please help i cant seem to figure it out. The table below shows historical end-of-week adjusted close prices (including dividends) for a stock and the
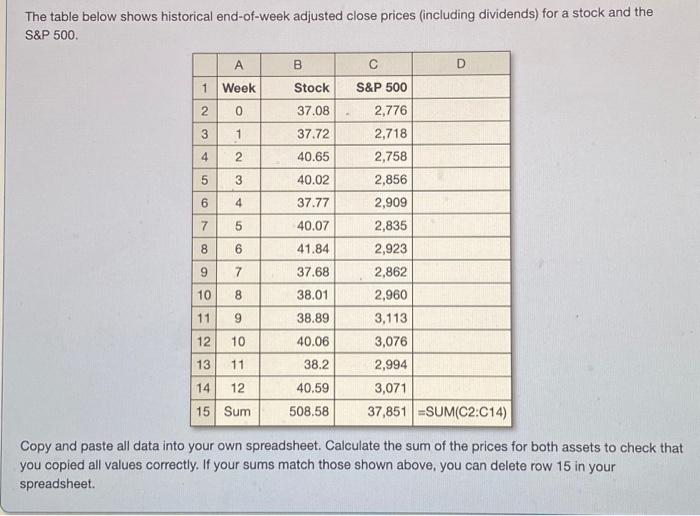
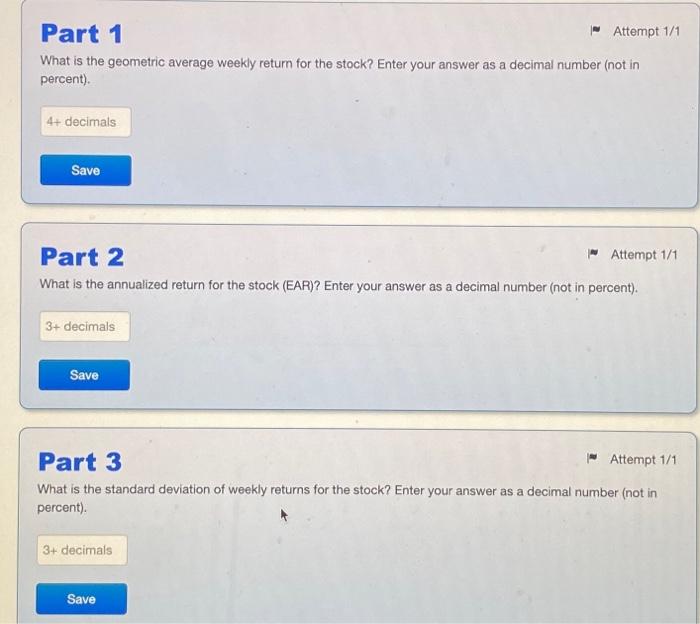
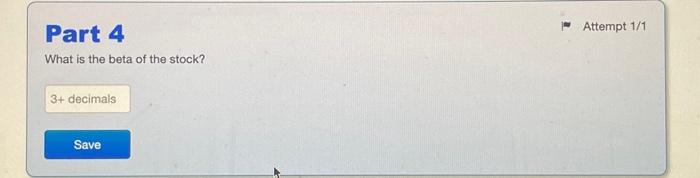
The table below shows historical end-of-week adjusted close prices (including dividends) for a stock and the S\&P 500 , Copy and paste all data into your own spreadsheet. Calculate the sum of the prices for both assets to check that you copied all values correctly. If your sums match those shown above, you can delete row 15 in your spreadsheet. What is the geometric average weekly retum for the stock? Enter your answer as a decimal number (not in percent). Part 2 Attempt 1/1 What is the annualized return for the stock (EAR)? Enter your answer as a decimal number (not in percent). Part 3 Attempt 1/1 What is the standard deviation of weekly returns for the stock? Enter your answer as a decimal number (not in percent). What is the beta of the stock
Step by Step Solution
There are 3 Steps involved in it

Get step-by-step solutions from verified subject matter experts