Question: Please help. I do not know how to complete this. Please show work. Doesn't even have to be 100 percent correct. UNGBrew has requested that
Please help. I do not know how to complete this. Please show work. Doesn't even have to be 100 percent correct.
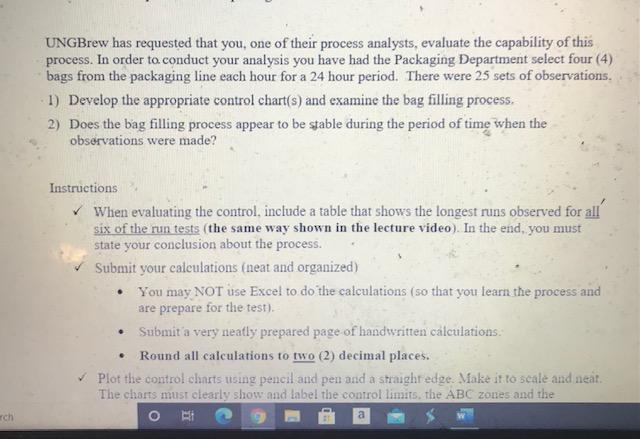
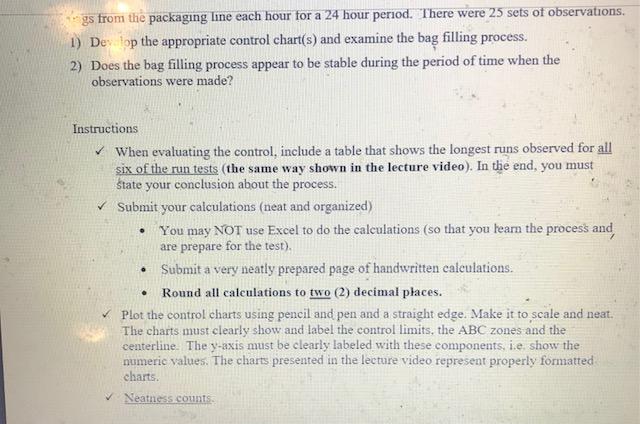
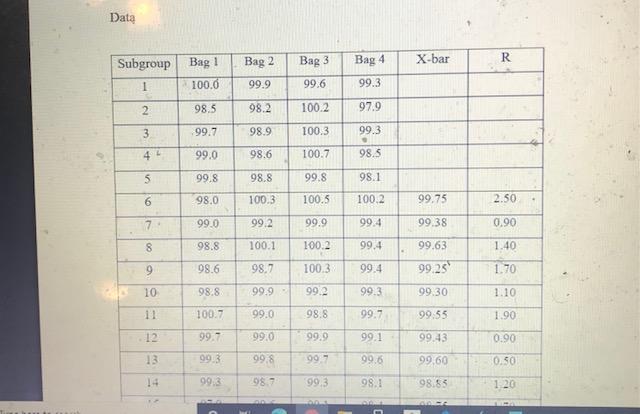
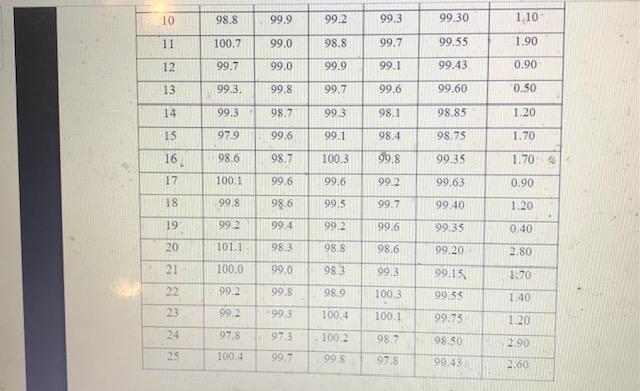
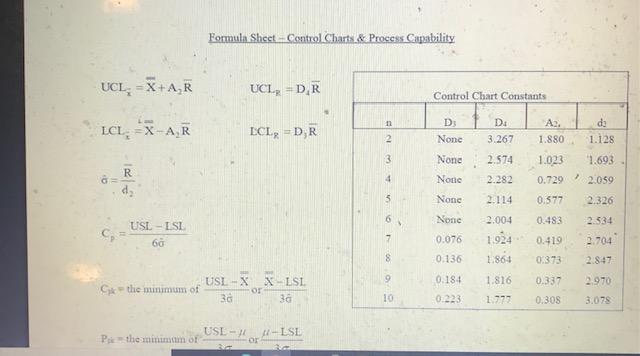
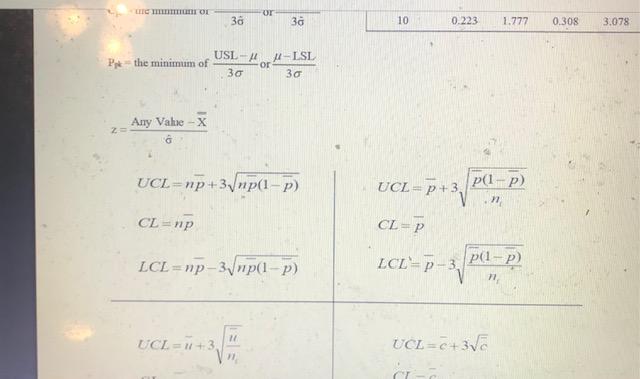
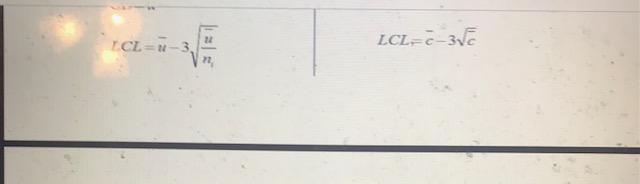
UNGBrew has requested that you, one of their process analysts, evaluate the capability of this process. In order to conduct your analysis you have had the Packaging Department select four (4) bags from the packaging line each hour for a 24 hour period. There were 25 sets of observations. 1) Develop the appropriate control chart(s) and examine the bag filling process. 2) Does the bag filling process appear to be stable during the period of time when the observations were made? Instructions When evaluating the control. include a table that shows the longest runs observed for all six of the run tests (the same way shown in the lecture video. In the end, you must state your conclusion about the process. Submit your caleulations (neat and organized) You may NOT use Excel to do the calculations (so that you learn the process and are prepare for the test). Submit a very neatly prepared page of handwritten calculations: Round all calculations to two (2) decimal places. Plot the control charts using pencil and pen and a straighredge. Make it to scale and neat. The charts must clearly show and label the control limits, the ABC zones and the rch a gs from the packaging line each hour for a 24 hour period. There were 25 sets of observations 1) Delop the appropriate control chart(s) and examine the bag filling process. 2) Does the bag filling process appear to be stable during the period of time when the observations were made? Instructions When evaluating the control, include a table that shows the longest runs observed for all six of the run tests (the same way shown in the lecture video). In the end, you must state your conclusion about the process. Submit your calculations (neat and organized) You may NOT use Excel to do the calculations (so that you learn the process and are prepare for the test), Submit a very neatly prepared page of handwritten calculations. Round all calculations to two (2) decimal places. Plot the control charts using pencil and pen and a straight edge. Make it to scale and neat. The charts must clearly show and label the control limits, the ABC zones and the centerline. The y-axis must be clearly labeled with these components, i.e show the numeric values. The charts presented in the lecture video represent properly formatted charts Neatness counts Data Subgroup R Bag 1 Bag 2 Bag 3 Bag 4 X-bar 1 100.0 99.9 99.6 99.3 98.5 98.2 100.2 97.9 99.7 98.9 100.3 99.3 44 99.0 98.6 100.7 98.5 5 99.8 98.8 99.8 98.1 6 98,0 100.3 100.5 100.2 99.75 2.50 7 99.0 99.2 99.9 99.4 99.38 0.90 00 98.8 100.1 100.2 99.4 99.63 1.40 9 08.6 98.7 100.3 99.4 9925 1.70 10 98.8 99.9 992 99.3 99.30 1.10 11 100.7 99.0 98.8 99.7 99.55 1.90 12 99.7 99.0 99.9 99.1 99.43 0.90 13 99.3 99,8 997 99.6 99.60 0.50 14 99.3 98.7 99.3 98.1 98.85 1.20 10 98.8 99.9 99.2 99.3 99.30 1.10 11 100.7 99.0 98.8 99.7 99.55 1.90 12 99.7 99.0 99.9 99.1 99.43 0.90 13 99.3. 99.8 99.7 99.6 99.60 0.50 14 99,3 98.7 993 98.1 98.85 1.20 15 979 99.6 99.1 98.4 98.75 1.70 16 98.6 98.7 100.3 99.8 99.35 1.704 17 100.1 99.6 99.6 99.2 99.63 0.90 18 99.8 98.6 99.5 99.7 99.40 1.20 19 99.2 99.4 99.2 99.6 99.35 0.40 20 101.1 98.3 98.8 98.6 99.20 2.80 21 100.0 99.0 983 99.3 99.15 1.70 22 99.2 99.8 98.9 100.3 99.53 1.40 23 99.2 99.3 100.4 100.1 99.75 1.20 24 97.8 973 1002 98.7 98.50 2.90 25 100.4 99.1 99.5 97.8 99.43 2.60 Formula Shest - Control Charts & Process Capability UCL X+AR UCI, DR Control Chart Constants n DA LCL =X-AR LCL, - DR D None A. 1.880 de 1.128 2 3.267 3 Nond "1.693 R de 2.574 2.282 4 Nons 1.023 0.729 0.577 2.059 5 None 2.114 2.326 None USL - ISI 0.483 2.534 2.004 1924 60 7 0.076 0.419 2.704 8 0.136 1 86 0.373 2.8 47 9 0.18+ 1.816 0.337 2.970 USL-X X ISI Cx- the minimum of or 3d 36 10 0:223 1.773 0.308 3.075 USE- Pe the minimum of - LSI OF 30 30 10 0.223 1.777 0.308 3.078 Pythe minimum of USL- 30 MISL or 30 Any Value - X 2 UCL-np+3, np(1-P) CL= np UCL=p+3, p(1-P) . CL-P LCL-p-3 pelp P-31 n LCL=mp-31np(1-P) 17 UCL = 11+3 UCL=+3V 22 CL=N-3 LCL, c 3


