

Question: Please help, I do not understand how to figure this out. The 2010 National Hospital Ambulatory Medical Care Survey (NHAMCS) is a national (United States)
Please help, I do not understand how to figure this out.
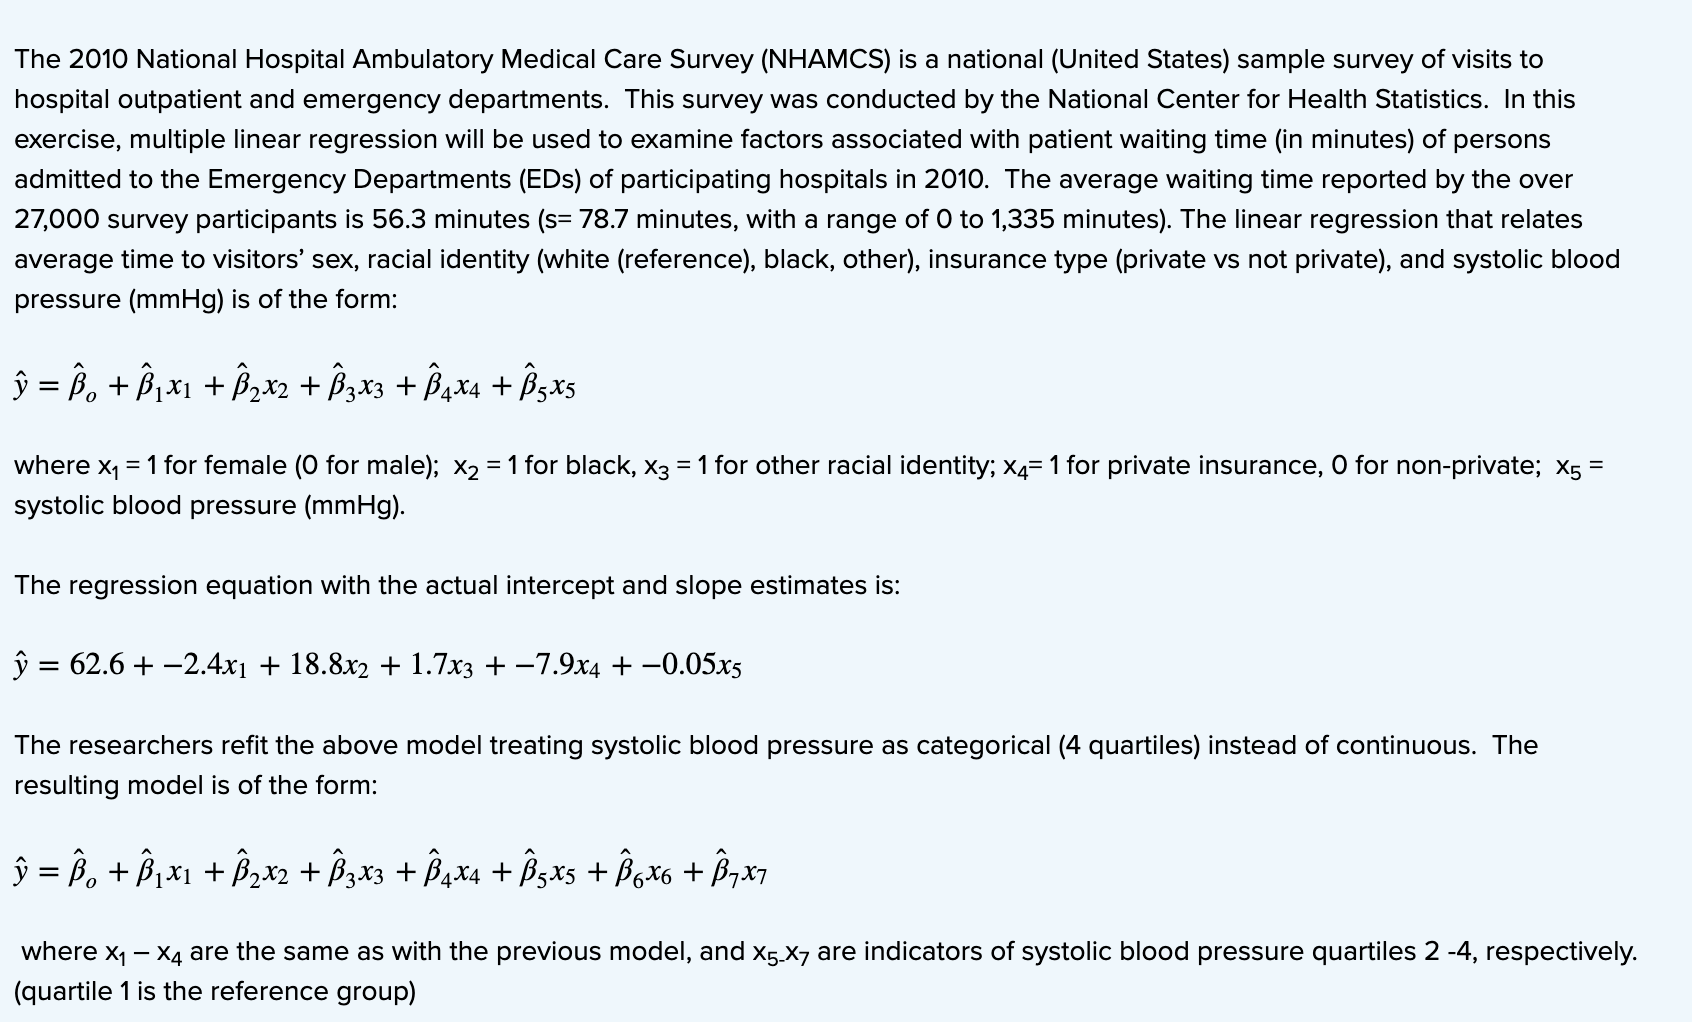
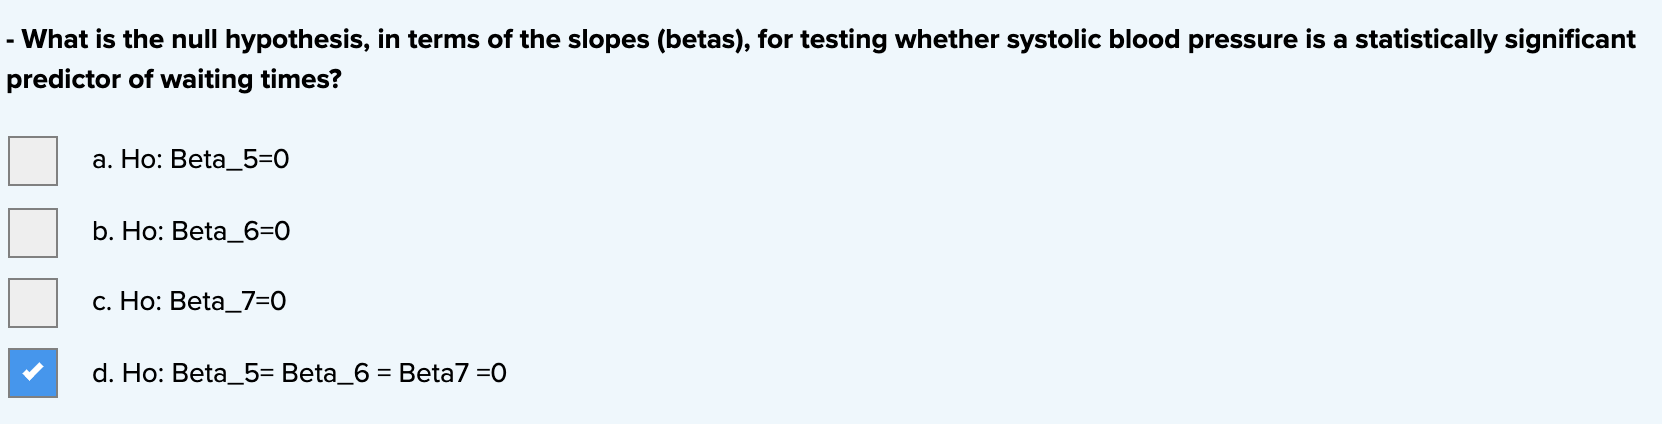
The 2010 National Hospital Ambulatory Medical Care Survey (NHAMCS) is a national (United States) sample survey of visits to hospital outpatient and emergency departments. This survey was conducted by the National Center for Health Statistics. In this exercise, multiple linear regression will be used to examine factors associated with patient waiting time (in minutes) of persons admitted to the Emergency Departments (EDS) of participating hospitals in 2010. The average waiting time reported by the over 27,000 survey participants is 56.3 minutes (5: 78.7 minutes, with a range of 0 to 1,335 minutes). The linear regression that relates average time to visitors' sex, racial identity (white (reference), black, other), insurance type (private vs not private), and systolic blood pressure (mmHg) is of the form: 5) = g + [31x1 + [32.762 + [33.753 + 4x4 +5x5 where x1 =1 for female (0 for male); x2 =1 for black, x3 =1 for other racial identity; x4: 1 for private insurance, 0 for nonprivate; x5 = systolic blood pressure (mmHg). The regression equation with the actual intercept and slope estimates is: 51 = 62.6 + 2.4x1 + 18.8262 + 1.7m + 7.9x4 + 0.05x5 The researchers ret the above model treating systolic blood pressure as categorical (4 quartiles) instead of continuous. The resulting model is of the form: J7 = 160 + 13le + 132352 + [33753 + 34754 +1653\" + x + [37157 where x1 x4 are the same as with the previous model, and x5x7 are indicators of systolic blood pressure quartiles 2 -4, respectively. (quartile 1 is the reference group) - What is the null hypothesis, in terms of the slopes (betas), for testing whether systolic blood pressure is a statistically signicant predictor of waiting times? a. Ho: Beta_5=0 b. Ho: Beta_6=0 c. Ho: Beta_7=0 d. Ho: Beta_5= Beta_6 = Beta7 =0
Step by Step Solution
There are 3 Steps involved in it

Get step-by-step solutions from verified subject matter experts