

Question: When looking at this how can you determine if there is a relationship being confounded or not? I find this quite difficult to get my
When looking at this how can you determine if there is a relationship being confounded or not? I find this quite difficult to get my head around
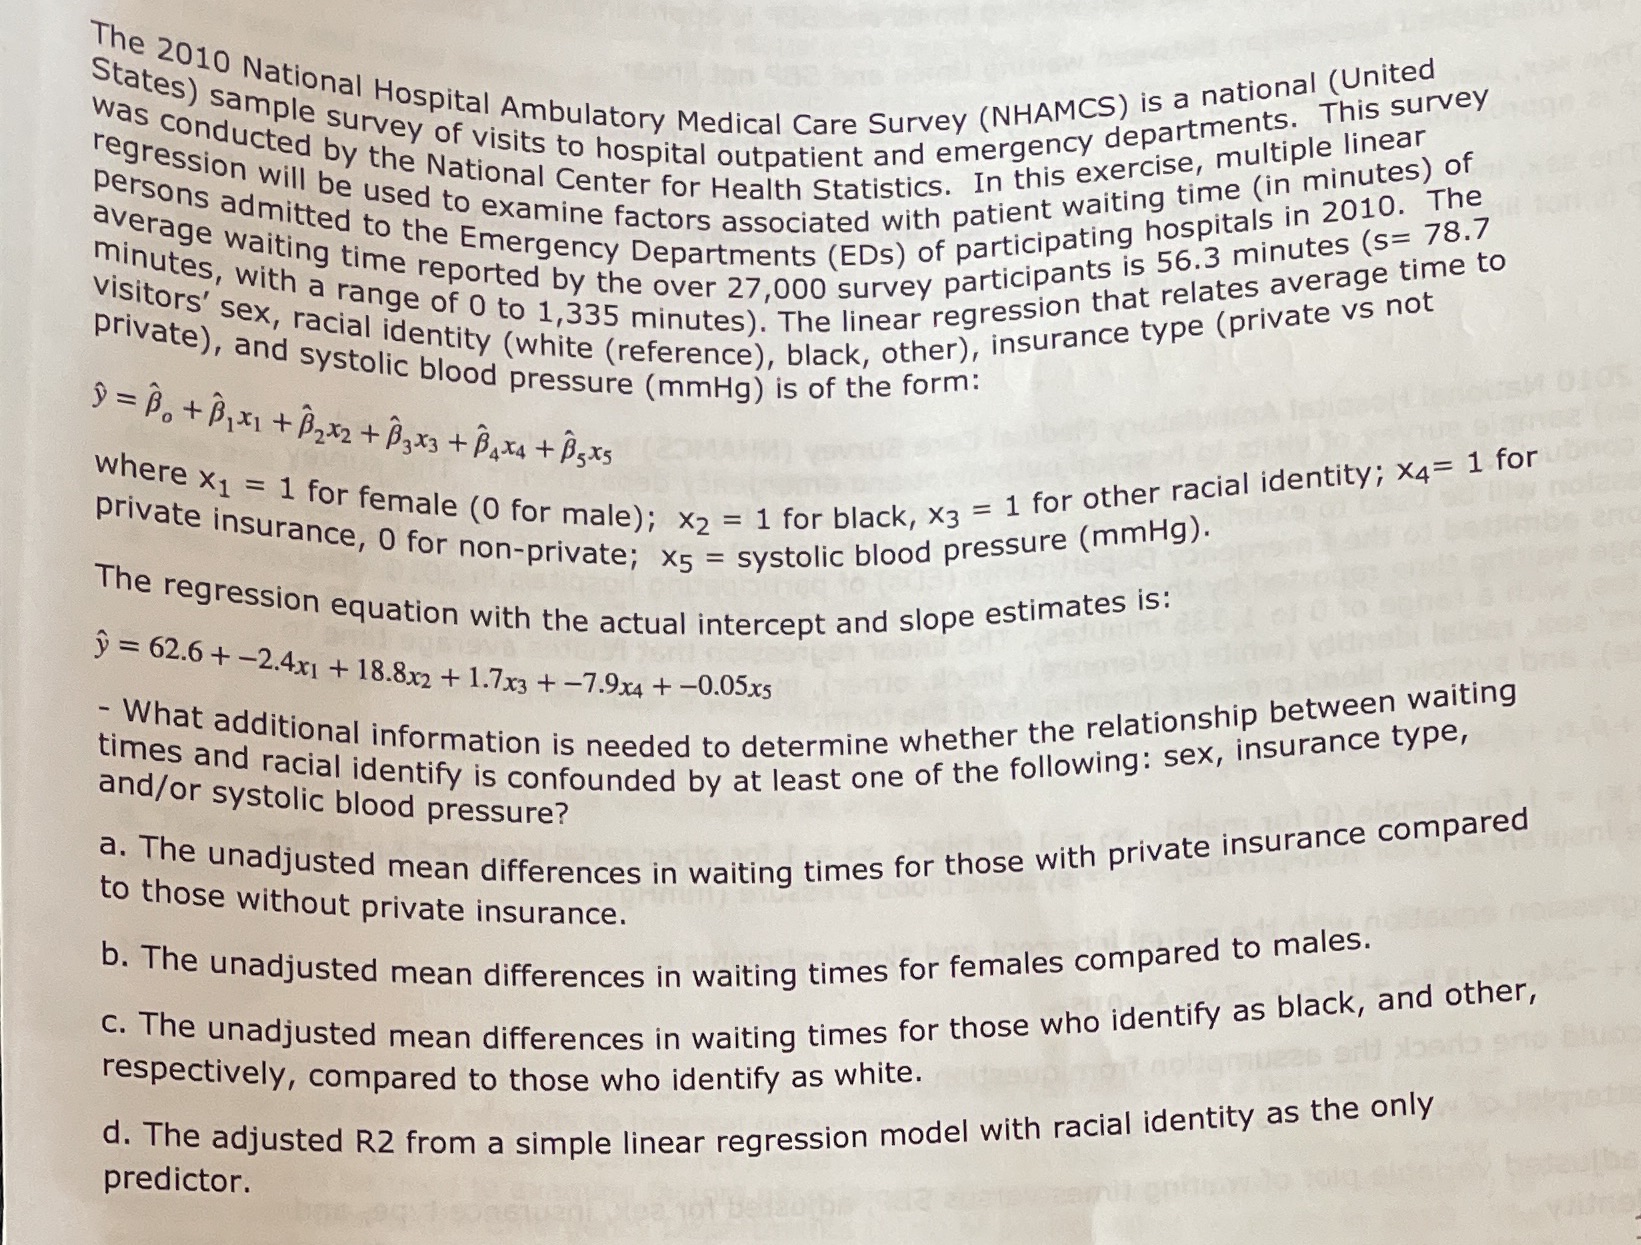
The 2010 National Hospital Ambulatory Medical Care Survey (NHAMCS) is a national (United States) sample survey of visits to hospital outpatient and emergency departments. This survey was conducted by the National Center for Health Statistics. In this exercise, multiple linear regression will be used to examine factors associated with patient waiting time (in minutes) of persons admitted to the Emergency Departments (EDs) of participating hospitals in 2010. The average waiting time reported by the over 27,000 survey participants is 56.3 minutes (s= 78.7 minutes, with a range of 0 to 1,335 minutes). The linear regression that relates average time to visitors' sex, racial identity (white (reference), black, other), insurance type (private vs not private), and systolic blood pressure (mmHg) is of the form: " = Bo+ BIX1+ 12x2 + Bgx3 + BAx4+ Bsx's where x1 = 1 for female (0 for male); x2 = 1 for black, x3 = 1 for other racial identity; x4= 1 for private insurance, 0 for non-private; x5 = systolic blood pressure (mmHg). The regression equation with the actual intercept and slope estimates is: " = 62.6 + -2.4x1 + 18.8x2 + 1.7x3 + -7.9x4 + -0.05x5 - What additional information is needed to determine whether the relationship between waiting times and racial identify is confounded by at least one of the following: sex, insurance type, and/or systolic blood pressure? a. The unadjusted mean differences in waiting times for those with private insurance compared to those without private insurance. b. The unadjusted mean differences in waiting times for females compared to males. c. The unadjusted mean differences in waiting times for those who identify as black, and other, respectively, compared to those who identify as white. d. The adjusted R2 from a simple linear regression model with racial identity as the only predictor
Step by Step Solution
There are 3 Steps involved in it

Get step-by-step solutions from verified subject matter experts