

Question: please help!! I need help ASAP Below are the range and standard deviation for a set of data. Use the range rule of thumb and
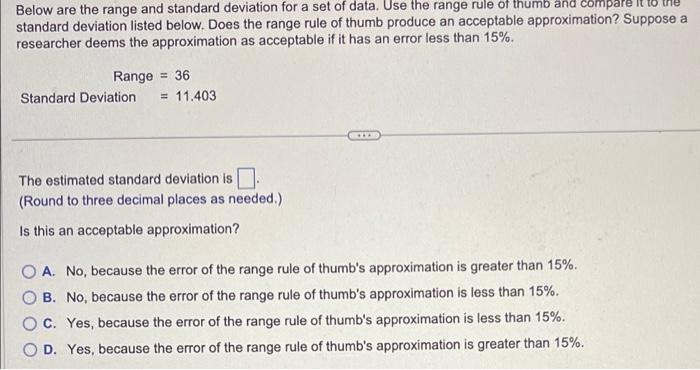
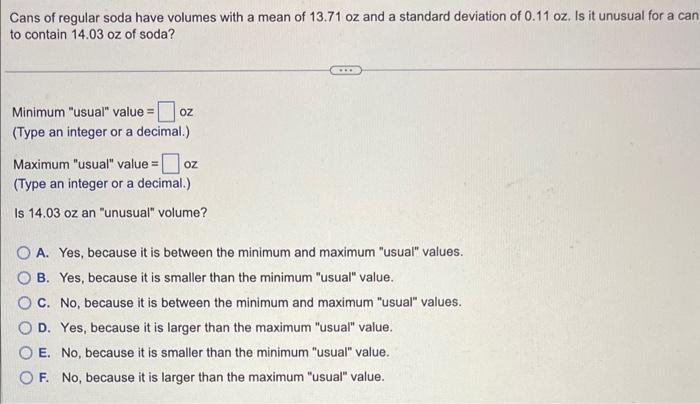
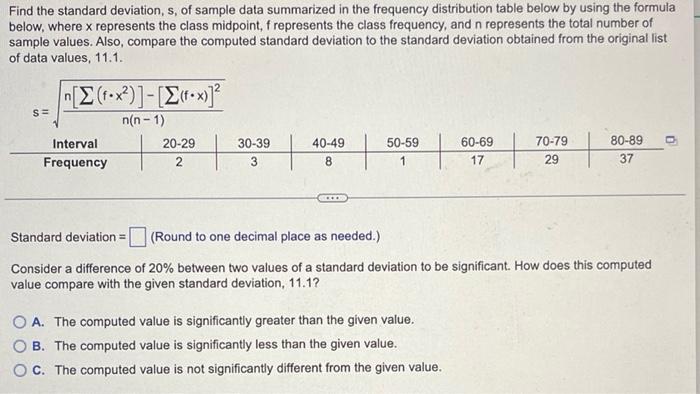
Below are the range and standard deviation for a set of data. Use the range rule of thumb and compare itto the standard deviation listed below. Does the range rule of thumb produce an acceptable approximation? Suppose a researcher deems the approximation as acceptable if it has an error less than 15%. Range=36 Standard Deviation =11.403 The estimated standard deviation is (Round to three decimal places as needed.) Is this an acceptable approximation? A. No, because the error of the range rule of thumb's approximation is greater than 15%. B. No, because the error of the range rule of thumb's approximation is less than 15%. C. Yes, because the error of the range rule of thumb's approximation is less than 15%. D. Yes, because the error of the range rule of thumb's approximation is greater than 15%. Cans of regular soda have volumes with a mean of 13.71oz and a standard deviation of 0.11oz. Is it unusual for a can to contain 14.03oz of soda? Minimum "usual" value =oz (Type an integer or a decimal.) Maximum "usual" value = oz (Type an integer or a decimal.) Is 14.03oz an "unusual" volume? A. Yes, because it is between the minimum and maximum "usual" values. B. Yes, because it is smaller than the minimum "usual" value. C. No, because it is between the minimum and maximum "usual" values. D. Yes, because it is larger than the maximum "usual" value. E. No, because it is smaller than the minimum "usual" value. F. No, because it is larger than the maximum "usual" value. Find the standard deviation, s, of sample data summarized in the frequency distribution table below by using the formula below, where x represents the class midpoint, f represents the class frequency, and n represents the total number of sample values. Also, compare the computed standard deviation to the standard deviation obtained from the original list of data values, 11.1. s=n(n1)n[(fx2)][(fx)]2 Standard deviation = (Round to one decimal place as needed.) Consider a difference of 20% between two values of a standard deviation to be significant. How does this computed value compare with the given standard deviation, 11.1? A. The computed value is significantly greater than the given value. B. The computed value is significantly less than the given value. C. The computed value is not significantly different from the given value
Step by Step Solution
There are 3 Steps involved in it

Get step-by-step solutions from verified subject matter experts