

Question: please help!! I need help ASAP Listed below are the durations (in hours) of a simple random sample of all fights of a space shuttle.
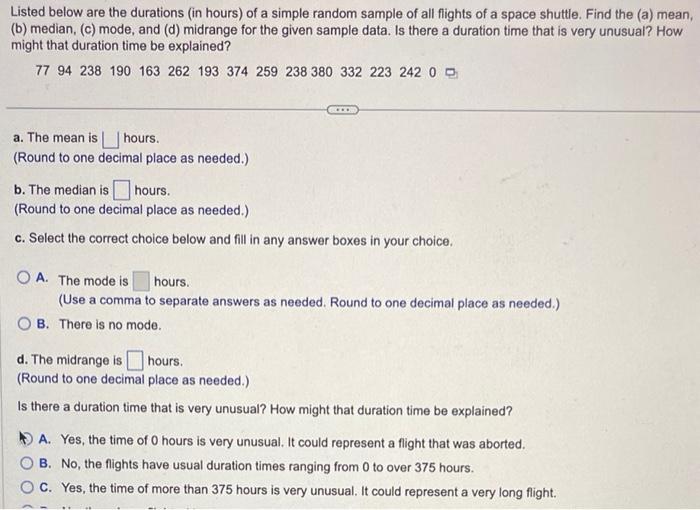
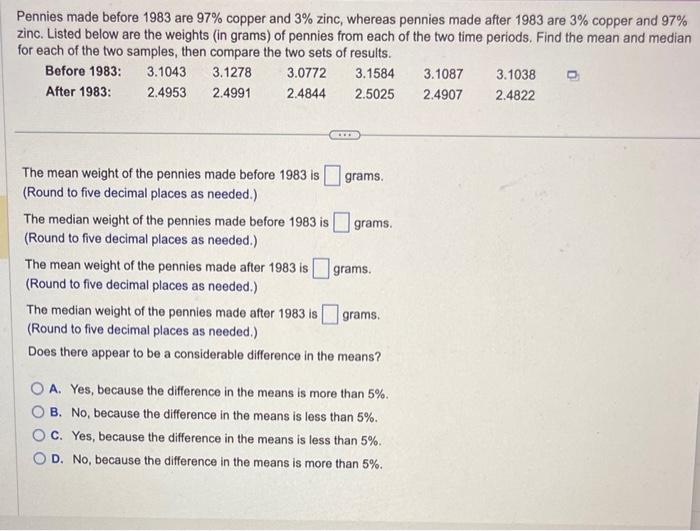
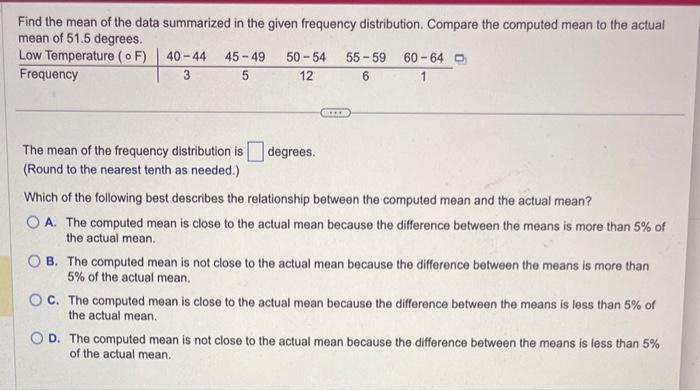
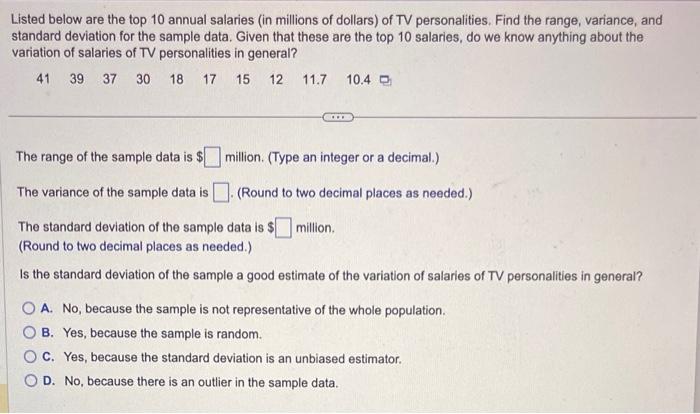
Listed below are the durations (in hours) of a simple random sample of all fights of a space shuttle. Find the (a) mean, (b) median, (c) mode, and (d) midrange for the given sample data. Is there a duration time that is very unusual? How might that duration time be explained? a. The mean is hours. (Round to one decimal place as needed.) b. The median is hours. (Round to one decimal place as needed.) c. Select the correct choice below and fill in any answer boxes in your choice. A. The mode is hours. (Use a comma to separate answers as needed. Round to one decimal place as needed.) B. There is no mode. d. The midrange is hours. (Round to one decimal place as needed.) Pennies made before 1983 are 97% copper and 3% zinc, whereas pennies made after 1983 are 3% copper and 97% zinc. Listed below are the weights (in grams) of pennies from each of the two time periods. Find the mean and median for each of the two samples, then compare the two sets of results. The mean weight of the pennies made before 1983 is grams. (Round to five decimal places as needed.) The median weight of the pennies made before 1983 is grams. (Round to five decimal places as needed.) The mean weight of the pennies made after 1983 is grams. (Round to five decimal places as needed.) The median weight of the pennies made after 1983 is grams. (Round to five decimal places as needed.) Does there appear to be a considerable difference in the means? A. Yes, because the difference in the means is more than 5%. B. No, because the difference in the means is less than 5%. C. Yes, because the difference in the means is less than 5%. D. No, because the difference in the means is more than 5%. Find the mean of the data summarized in the given frequency distribution. Compare the computed mean to the actual mean of 51.5 dearees. The mean of the frequency distribution is degrees. (Round to the nearest tenth as needed.) Which of the following best describes the relationship between the computed mean and the actual mean? A. The computed mean is close to the actual mean because the difference between the means is more than 5% of the actual mean. B. The computed mean is not close to the actual mean because the difference between the means is more than 5% of the actual mean. C. The computed mean is close to the actual mean because the difference between the means is less than 5% of the actual mean. D. The computed mean is not close to the actual mean because the difference between the means is less than 5% of the actual mean. Listed below are the top 10 annual salaries (in millions of dollars) of TV personalities. Find the range, variance, and standard deviation for the sample data. Given that these are the top 10 salaries, do we know anything about the variation of salaries of TV personalities in general? The range of the sample data is $ million. (Type an integer or a decimal.) The variance of the sample data is (Round to two decimal places as needed.) The standard deviation of the sample data is $ million. (Round to two decimal places as needed.) Is the standard deviation of the sample a good estimate of the variation of salaries of TV personalities in general? A. No, because the sample is not representative of the whole population. B. Yes, because the sample is random. C. Yes, because the standard deviation is an unbiased estimator. D. No, because there is an outlier in the sample data
Step by Step Solution
There are 3 Steps involved in it

Get step-by-step solutions from verified subject matter experts