

Question: Please Help. I'm trying to Develop MAtlab code to read and plot the values for CO2 concentrations for a data set. The data Im using
Please Help.
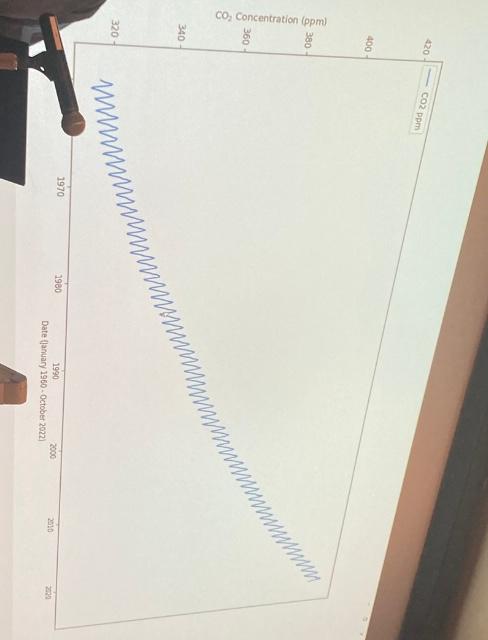
I'm trying to Develop MAtlab code to read and plot the values for CO2 concentrations for a data set. The data Im using is formulated like this and I'm trying to convert this data (which is in a csv file) into Matlab. So year, month, and Co2 Concentration from 1960 to month 10 of 2022. I need to import this data into matlab and graph the results as seen in the graph.
The second part is Developing code to determine the average CO2 concentrations for each calendar year. Plot this new data set on the same graph as generated but Select a new line type/weight/marker to distinguish this data from the full data set plot and Include a legend for the full data set and average output on your graph.
I know you don't have the csv file but if you could give me some sort of code that would get me on the right track that would be awesome and I'll give thumbs up. Thank you.
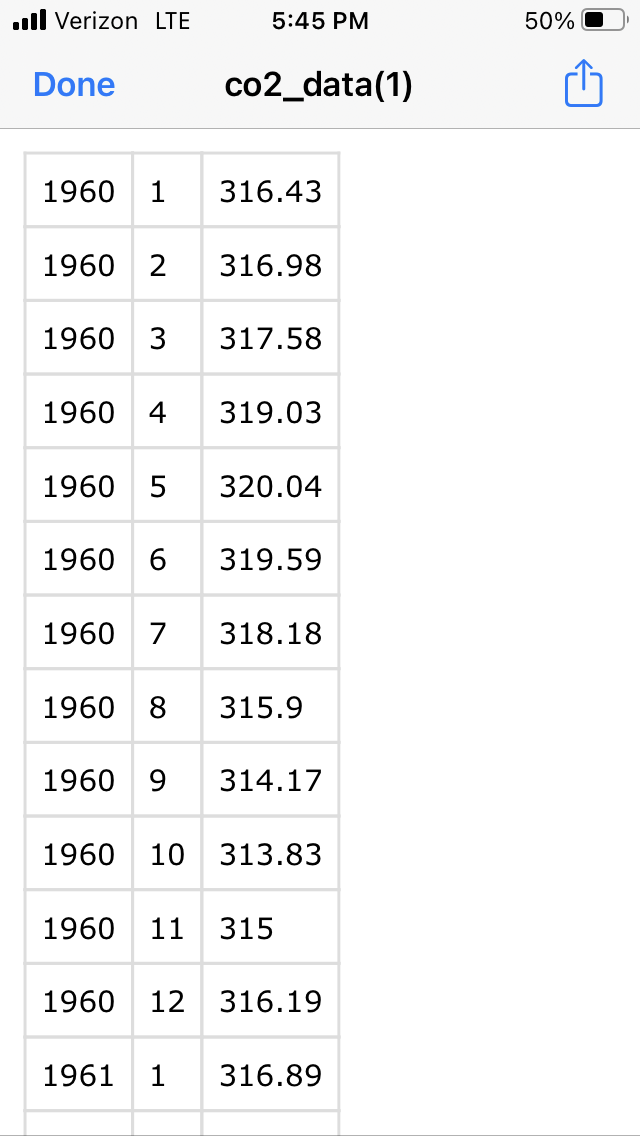
ullVerizonLTE5:45PM50% Done co2_data(1) \begin{tabular}{|l|l|l|} \hline 1960 & 1 & 316.43 \\ \hline 1960 & 2 & 316.98 \\ \hline 1960 & 3 & 317.58 \\ \hline 1960 & 4 & 319.03 \\ \hline 1960 & 5 & 320.04 \\ \hline 1960 & 6 & 319.59 \\ \hline 1960 & 7 & 318.18 \\ \hline 1960 & 8 & 315.9 \\ \hline 1960 & 9 & 314.17 \\ \hline 1960 & 10 & 313.83 \\ \hline 1960 & 11 & 315 \\ \hline 1960 & 12 & 316.19 \\ \hline 1961 & 1 & 316.89 \\ \hline \end{tabular}
Step by Step Solution
There are 3 Steps involved in it

Get step-by-step solutions from verified subject matter experts