

Question: Please help In the graph on the right, the demand for sub sandwich rolls has changed because the price of sandwich meat has risen from
Please help
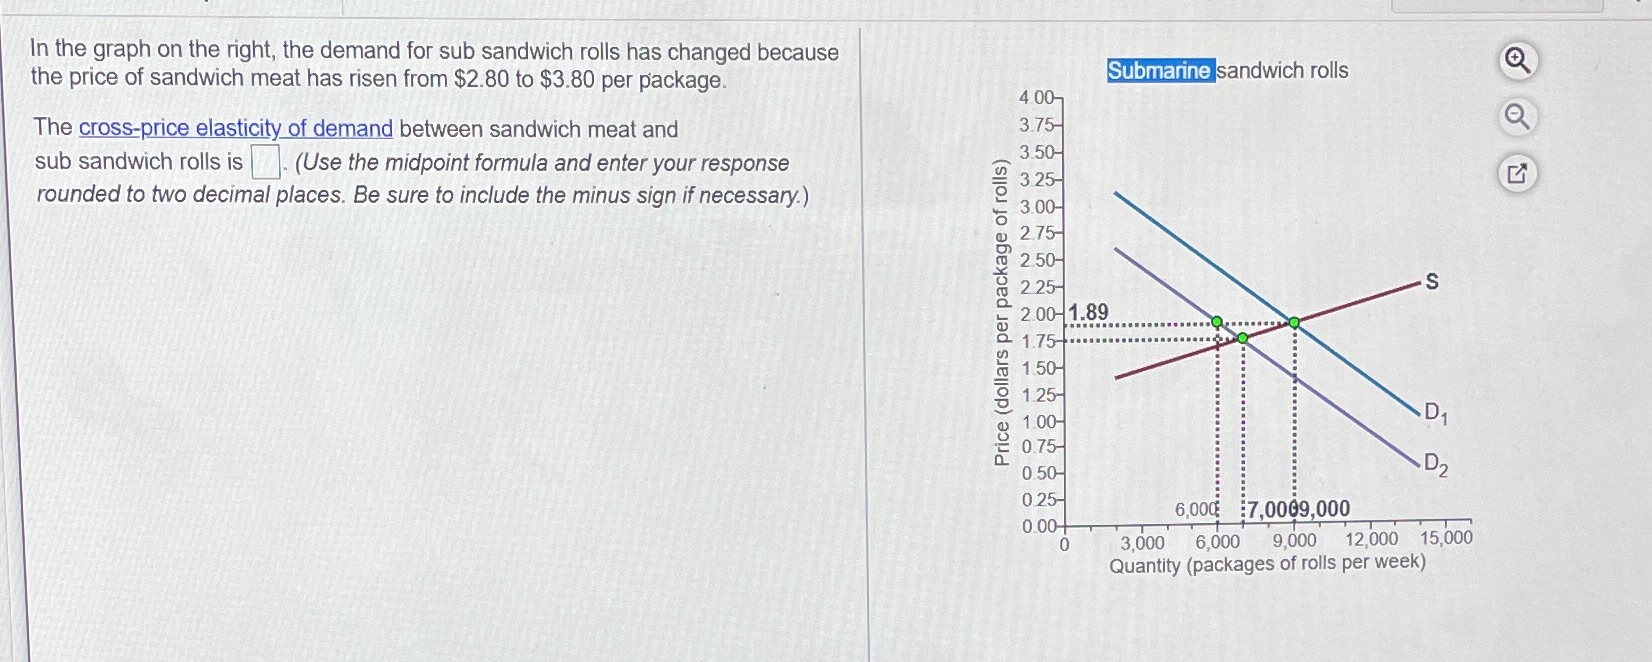
In the graph on the right, the demand for sub sandwich rolls has changed because the price of sandwich meat has risen from $2.80 to $3.80 per package. Submarine sandwich rolls 4 00- The cross-price elasticity of demand between sandwich meat and 3.75- sub sandwich rolls is . (Use the midpoint formula and enter your response 3.50- 3.25- rounded to two decimal places. Be sure to include the minus sign if necessary.) 3.00- 2.75- 2.50- 2 25- S Price (dollars per package of rolls) 2.00- 1.89 ... .. 1 50- 1.25- 1.00- D1 0.75- 0.50- D2 0.25- 6,000 :7,0009,000 0.00- 3,000 6,000 9,000 12,000 15,000 Quantity (packages of rolls per week)
Step by Step Solution
There are 3 Steps involved in it

Get step-by-step solutions from verified subject matter experts