

Question: Please help interpret the following data where the arrows are. 95% Confidence Interval for Average Age of Online College Students: Sample Mean: 30.82 Round 2
Please help interpret the following data where the arrows are.
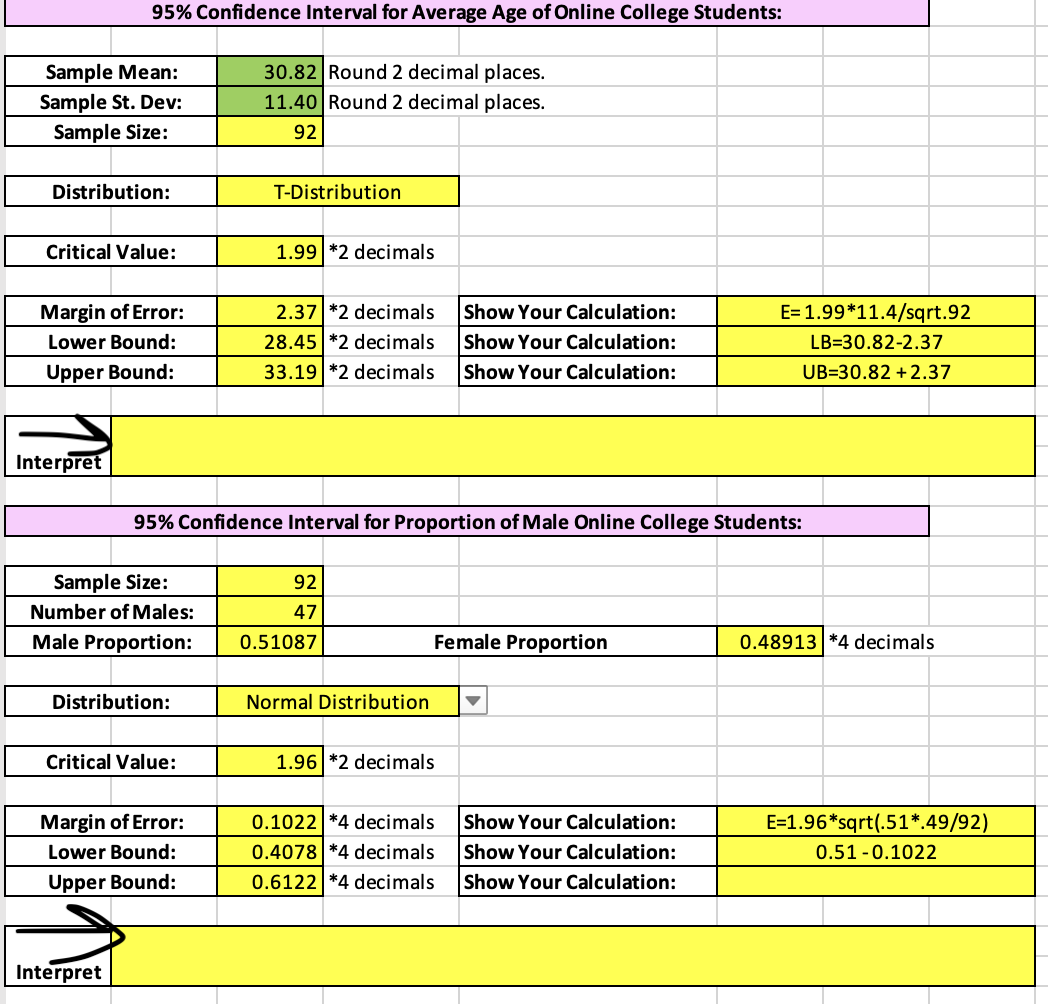
95% Confidence Interval for Average Age of Online College Students: Sample Mean: 30.82 Round 2 decimal places. Sample St. Dev: 11.40 Round 2 decimal places. Sample Size 92 Distribution: T-Distribution Critical Value: 1.99 *2 decimals Margin of Error: 2.37 *2 decimals Show Your Calculation: E=1.99*11.4/sqrt.92 Lower Bound: 28.45 *2 decimals Show Your Calculation: LB=30.82-2.37 Upper Bound: 33.19 *2 decimals Show Your Calculation: UB=30.82 +2.37 Interpret 95% Confidence Interval for Proportion of Male Online College Students: Sample Size: 92 Number of Males: 47 Male Proportion: 0.51087 Female Proportion 0.48913 *4 decimals Distribution: Normal Distribution Critical Value: 1.96 *2 decimals Margin of Error: 0.1022 *4 decimals Show Your Calculation: E=1.96*sqrt(.51*.49/92) Lower Bound: 0.4078 *4 decimals Show Your Calculation: 0.51 - 0.1022 Upper Bound: 0.6122 *4 decimals Show Your Calculation: Interpret
Step by Step Solution
There are 3 Steps involved in it

Get step-by-step solutions from verified subject matter experts