

Question: Please help me 1 Pearson's MyLab & I X 1 Pearson's MyLab & N X P Do Homework - Hom x Cuban Link Apologize x
Please help me
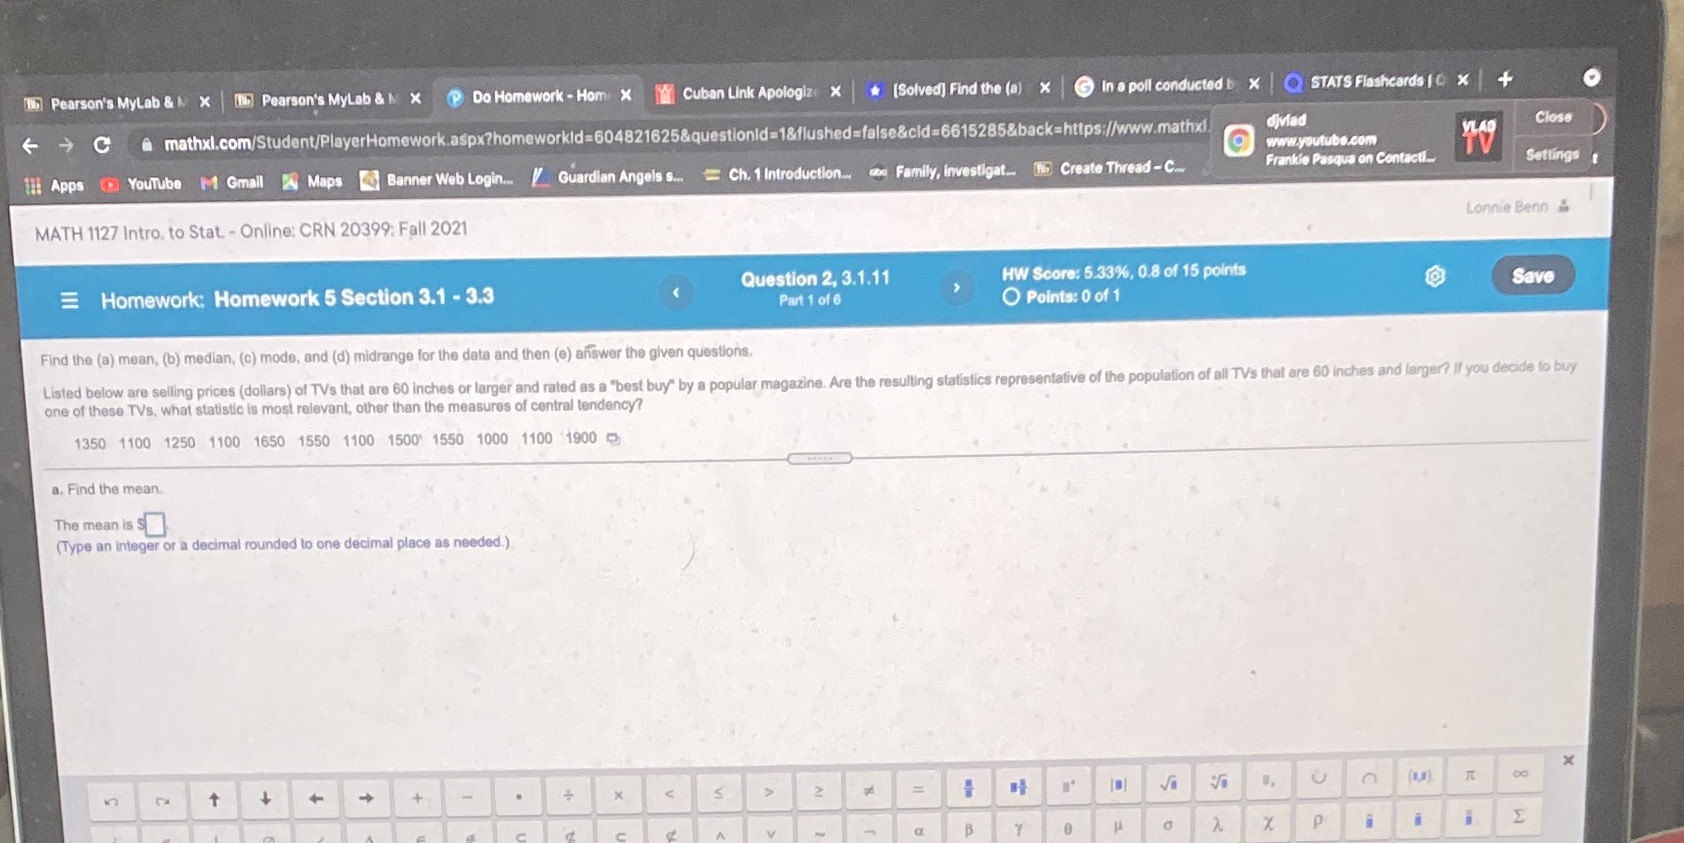
1 Pearson's MyLab & I X 1 Pearson's MyLab & N X P Do Homework - Hom x Cuban Link Apologize x (Solved] Find the (a) x @ In a poll conducted b x STATS Flashcards |0 x + C @ mathxl.com/Student/PlayerHomework.aspx?homeworkld=604821625&questionid=1&flushed=false&cld=6615285&back=https://www.mathxl. divlad www.youtube.com VLAD Close !Apps @ Youtube N Gmail Maps Banner Web Login.. // Guardian Angels s.. = Ch. 1 Introduction. do Family, investigat.. [ Create Thread - C. Frankie Pasqua on Contacti_. Settings MATH 1127 Intro. to Stat. - Online: CRN 20399: Fall 2021 Lonnie Benn Homework: Homework 5 Section 3.1 - 3.3 Question 2, 3.1.11 HW Score: 5.33%, 0.8 of 15 points Save Part 1 of 6 O Points: 0 of 1 Find the (a) mean, (b) median, (c) mode, and (d) midrange for the data and then (e) answer the given questions, Listed below are selling prices (dollars) of TVs that are 60 inches or larger and rated as a "best buy" by a popular magazine. Are the resulting statistics representative of the population of all TVs that are 60 inches and larger? If you decide to buy one of these TVs, what statistic is most relevant, other than the measures of central tendency? 1350 1100 1250 1100 1650 1550 1100 1500' 1550 1000 1100 1900 a. Find the mean. The mean is S (Type an integer or a decimal rounded to one decimal place as needed.) X S 2 U p 2
Step by Step Solution
There are 3 Steps involved in it

Get step-by-step solutions from verified subject matter experts