

Question: Please help me + Pearson's MyLab & M X B Pearson's MyLab & N X P Do Homework - Home X Cuban Link Apologize X
Please help me
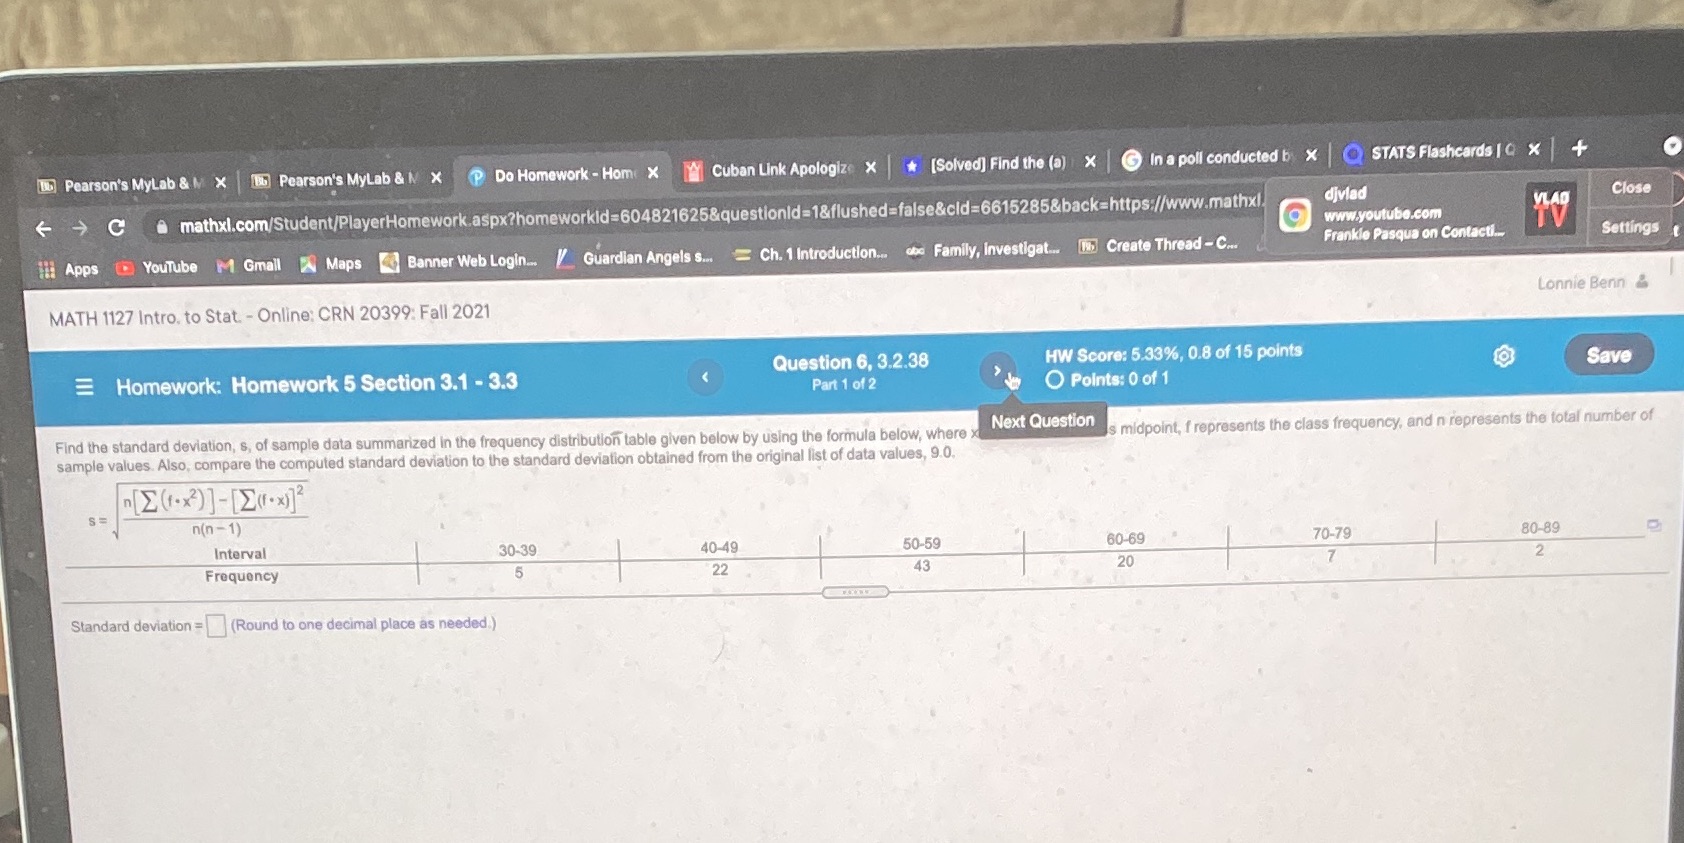
+ Pearson's MyLab & M X B Pearson's MyLab & N X P Do Homework - Home X Cuban Link Apologize X *[Solved] Find the (a) x In a poll conducted b x STATS Flashcards | Q X O C mathxl.com/Student/PlayerHomework.aspx?homeworkld=604821625&questionid=1&flushed=false&cld=6615285&back=https://www.mathxl. divlad VLAD Close www.youtube.com Apps YouTube M Gmail Maps Banner Web Login... / Guardian Angels s.. = Ch. 1 Introduction.. de Family, investigat.. [Is. Create Thread - C. Frankie Pasqua on Contacti.. Settings MATH 1127 Intro. to Stat. - Online: CRN 20399: Fall 2021 Lonnie Benin & Homework: Homework 5 Section 3.1 - 3.3 Question 6, 3.2.38 HW Score: 5.33%, 0.8 of 15 points Save Part 1 of 2 O Points: 0 of 1 Find the standard deviation, s, of sample data summarized in the frequency distribution table given below by using the formula below, where Next Question s midpoint, f represents the class frequency, and n represents the total number of sample values. Also, compare the computed standard deviation to the standard deviation obtained from the original list of data values, 9.0. [ E (.x) ]- [)(.x)] n(n - 1) Interval 30-39 40-49 50-59 60-69 70-79 80-89 Frequency 5 22 43 20 2 Standard deviation = (Round to one decimal place as needed.)
Step by Step Solution
There are 3 Steps involved in it

Get step-by-step solutions from verified subject matter experts