

Question: please help me 2. For which approximate Cutoff Value below is the Sensitivity less than what would be expected for random guessing? a. 0.35 b.
please help me 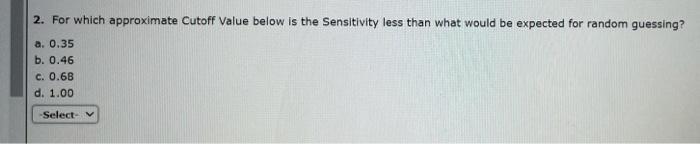
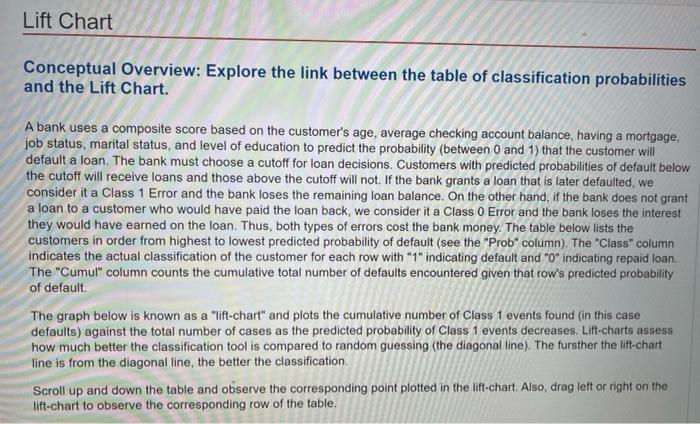
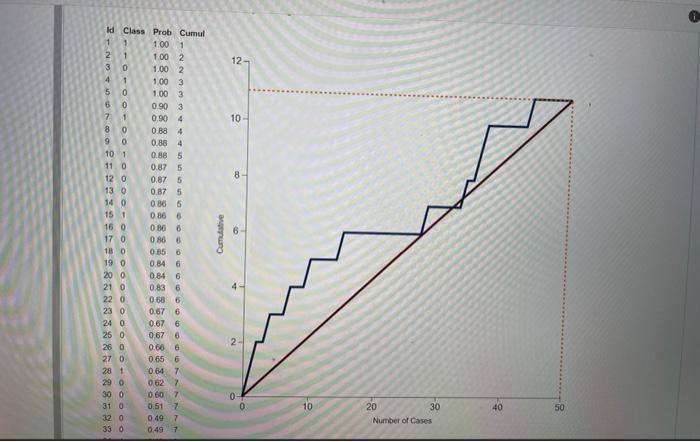
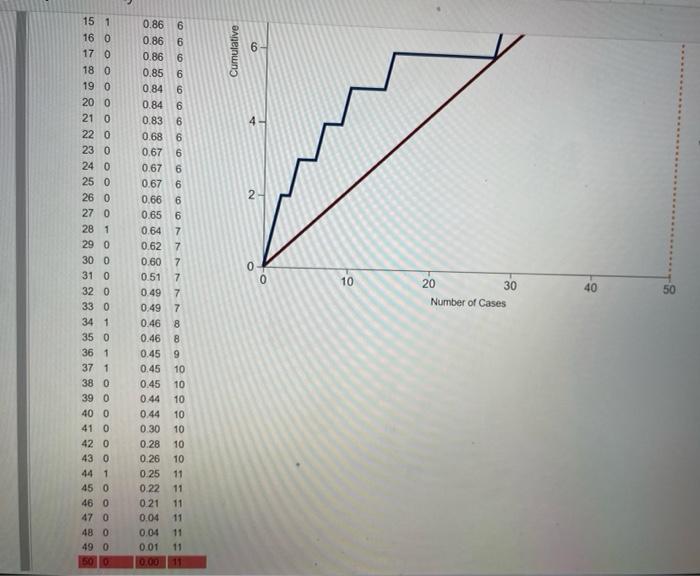
2. For which approximate Cutoff Value below is the Sensitivity less than what would be expected for random guessing? a. 0.35 b. 0.46 c. 0.68 d. 1.00 Select- Lift Chart Conceptual Overview: Explore the link between the table of classification probabilities and the Lift Chart. A bank uses a composite score based on the customer's age, average checking account balance, having a mortgage, job status, marital status, and level of education to predict the probability (between 0 and 1) that the customer will default a loan. The bank must choose a cutoff for loan decisions. Customers with predicted probabilities of default below the cutoff will receive loans and those above the cutoff will not. If the bank grants a loan that is later defaulted, we consider it a Class 1 Error and the bank loses the remaining loan balance. On the other hand, if the bank does not grant a loan to a customer who would have paid the loan back, we consider it a Class 0 Error and the bank loses the interest they would have earned on the loan. Thus, both types of errors cost the bank money. The table below lists the customers in order from highest to lowest predicted probability of default (see the "Prob" column). The "Class" column indicates the actual classification of the customer for each row with "1" indicating default and "O"indicating repaid loan The "Cumul" column counts the cumulative total number of defaults encountered given that row's predicted probability of default The graph below is known as a "lift-chart" and plots the cumulative number of Class 1 events found in this case defaults) against the total number of cases as the predicted probability of Class 1 events decreases. Lift-charts assess how much better the classification tool is compared to random guessing (the diagonal line). The fursther the lift-chart line is from the diagonal line, the better the classification Scroll up and down the table and observe the corresponding point plotted in the lift-chart. Also, drag left or right on the lift-chart to observe the corresponding row of the table. -O- 12- JOON 10 8 8 ld Class Prob Cumul 1 1 100 1 2 1 100 2 1.00 2 4 1 100 3 5 0 1.00 3 60 0.903 71 0.90 4 8 0 4 90 0.88 4 101 0.88 5 11.0 0.87 5 12 0 0.87 5 130 0.87 5 14 0 080 5 15 1 0.86 6 160 030 6 17 0 086 6 18 0 085 6 190 0.84 6 200 0.84 21 0 0.83 220 0686 23 0 0676 24 0 0676 250 0.67 6 26 0 0.666 270 0.65 6 28 1 0.64 7 29 0 0.627 300 0.60 7 31 0 0.61 32 0 0.49 7 33 0 0.49 7 Cumulative WOOOOOOO 0 10 40 50 20 30 Number of Cases 6 Cumulative 2 0 10 ======oooooOOOOOOOOOOOOOOOO 40 - 15 1 16 0 17 0 18 0 19 0 20 0 21 0 22 0 23 0 24 0 250 26 0 270 28 1 29 0 300 31 0 32 0 33 0 34 1 35 0 36 1 37 1 38 0 39 0 40 0 41 0 42 0 43 0 44 1 450 46 0 47 0 480 490 500 0.86 0.86 0.86 0.85 0.84 0.84 0.83 0.68 0.67 6 0.67 0.67 0.66 6 0.65 0.64 7 0.627 0.60 7 0.51 7 0.49 7 0.49 7 0.46 8 0.46 8 0.45 0.45 10 0.45 10 0.44 10 0.44 10 0.30 10 0.28 10 0.26 10 0.25 11 0.22 11 021 11 0.04 11 0.04 11 0.01 11 0.0011 20 30 Number of Cases 50 Step by Step Solution
There are 3 Steps involved in it
1 Expert Approved Answer
Step: 1 Unlock

Question Has Been Solved by an Expert!
Get step-by-step solutions from verified subject matter experts
Step: 2 Unlock
Step: 3 Unlock