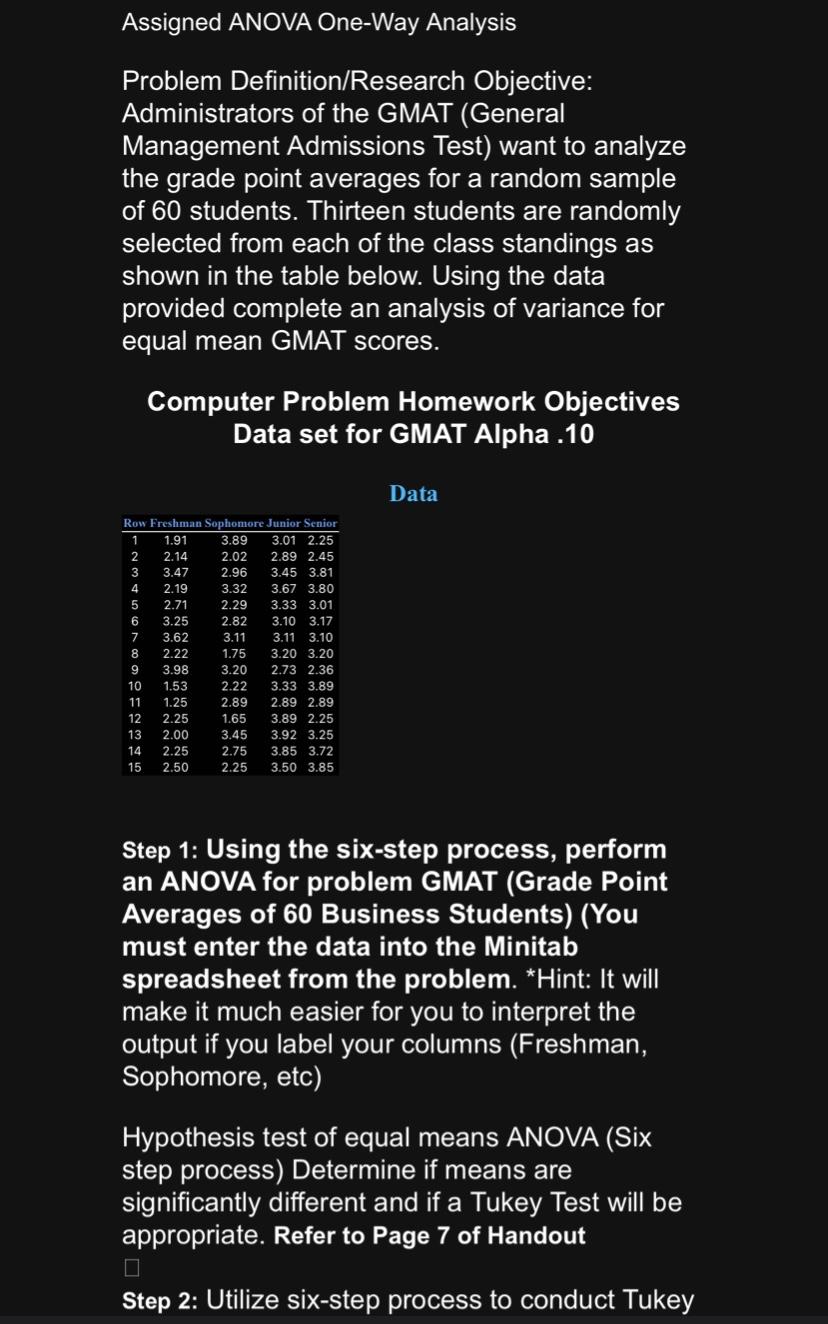
Question: Please help me and solve it by yourself please! Data set for GMAT Alpha .10 not .05 for population of 60. Don't paste posted answers

Please help me and solve it by yourself please! Data set for GMAT Alpha .10 not .05 for population of 60. Don't paste posted answers please I'll down vote.

Complete for the following:

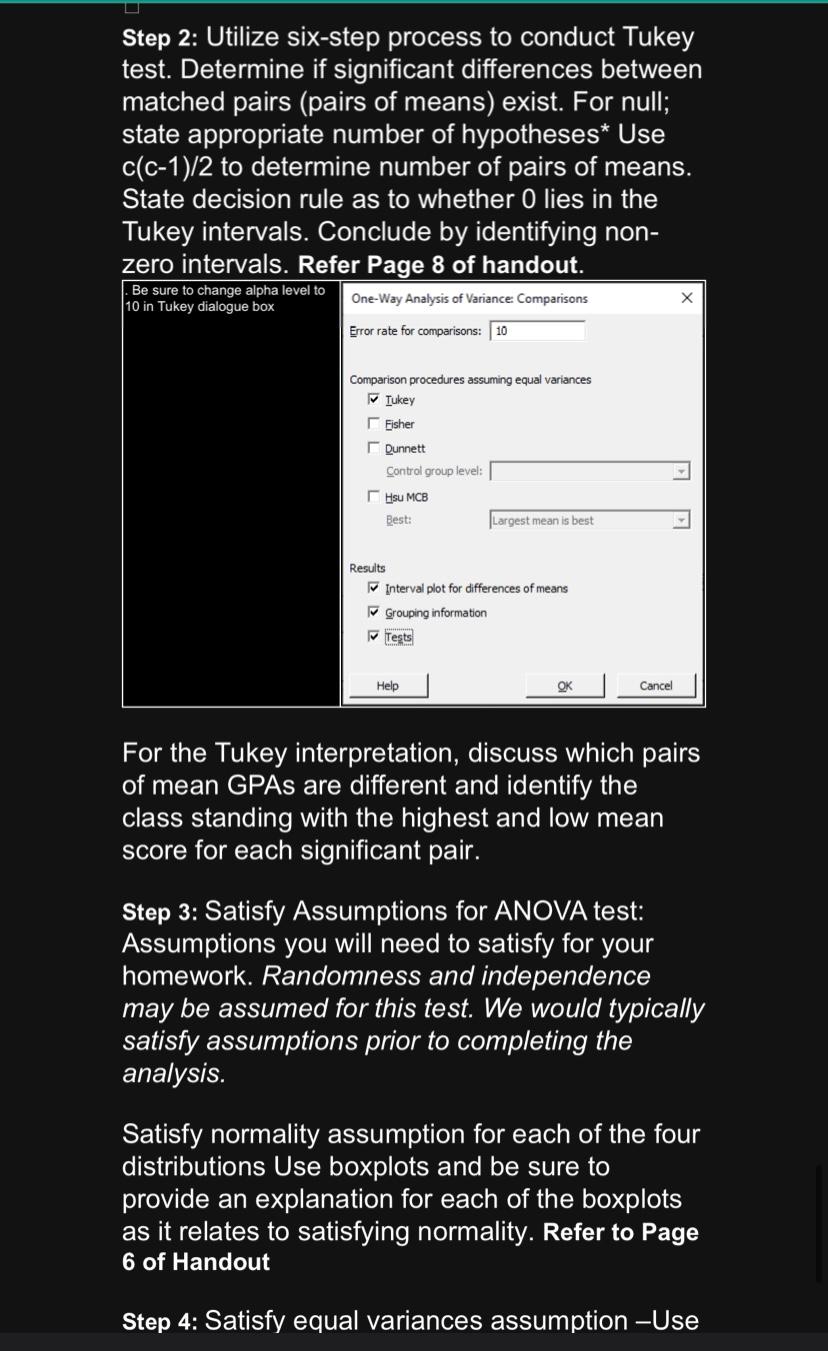
+ANOVA test of means

+Tukey Test

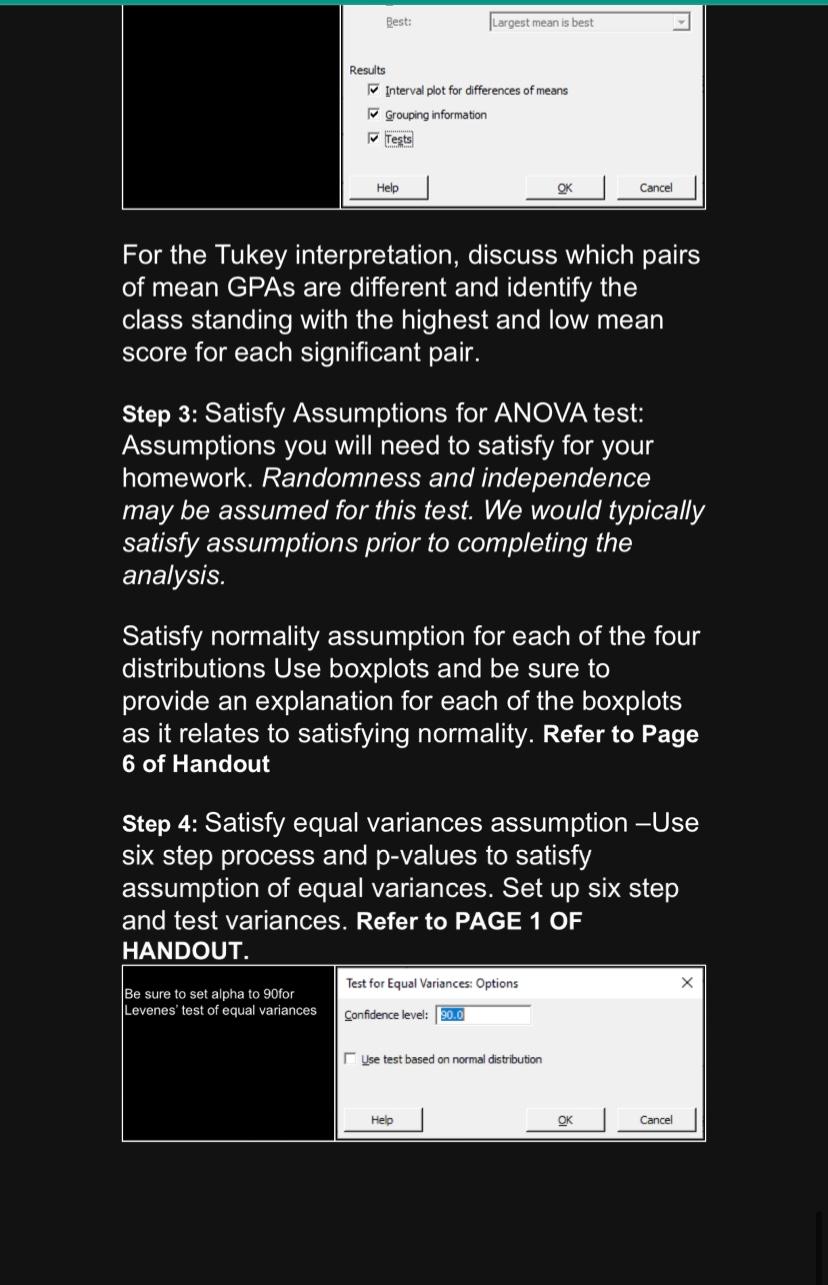
+Normality assumption

+Equal variance

Please help me and solve it by yourself please!

Please help me and solve it by yourself please!

Please help me and solve it by yourself please!

Please help me and solve it by yourself please!

Assigned ANOVA One-Way Analysis Problem Definition/Research Objective: Administrators of the GMAT (General Management Admissions Test) want to analyze the grade point averages for a random sample of 60 students. Thirteen students are randomly selected from each of the class standings as shown in the table below. Using the data provided complete an analysis of variance for equal mean GMAT scores. Computer Problem Homework Objectives Data set for GMAT Alpha.10 Data Step 1: Using the six-step process, perform an ANOVA for problem GMAT (Grade Point Averages of 60 Business Students) (You must enter the data into the Minitab spreadsheet from the problem. *Hint: It will make it much easier for you to interpret the output if you label your columns (Freshman, Sophomore, etc) Hypothesis test of equal means ANOVA (Six step process) Determine if means are significantly different and if a Tukey Test will be appropriate. Refer to Page 7 of Handout Step 2: Utilize six-step process to conduct Tukey \begin{tabular}{ccccc} \multicolumn{6}{c}{ Row Freshman Sophomore Junior Senior } \\ \hline 1 & 1.91 & 3.89 & 3.01 & 2.25 \\ 2 & 2.14 & 2.02 & 2.89 & 2.45 \\ 3 & 3.47 & 2.96 & 3.45 & 3.81 \\ 4 & 2.19 & 3.32 & 3.67 & 3.80 \\ 5 & 2.71 & 2.29 & 3.33 & 3.01 \\ 6 & 3.25 & 2.82 & 3.10 & 3.17 \\ 7 & 3.62 & 3.11 & 3.11 & 3.10 \\ 8 & 2.22 & 1.75 & 3.20 & 3.20 \\ 9 & 3.98 & 3.20 & 2.73 & 2.36 \\ 10 & 1.53 & 2.22 & 3.33 & 3.89 \\ 11 & 1.25 & 2.89 & 2.89 & 2.89 \\ 12 & 2.25 & 1.65 & 3.89 & 2.25 \\ 13 & 2.00 & 3.45 & 3.92 & 3.25 \\ 14 & 2.25 & 2.75 & 3.85 & 3.72 \\ 15 & 2.50 & 2.25 & 3.50 & 3.85 \end{tabular} Step 2: Utilize six-step process to conduct Tukey test. Determine if significant differences between matched pairs (pairs of means) exist. For null; state appropriate number of hypotheses* Use c(c1)/2 to determine number of pairs of means. State decision rule as to whether 0 lies in the Tukey intervals. Conclude by identifying nonzero intervals. Refer Page 8 of handout. For the Tukey interpretation, discuss which pairs of mean GPAs are different and identify the class standing with the highest and low mean score for each significant pair. Step 3: Satisfy Assumptions for ANOVA test: Assumptions you will need to satisfy for your homework. Randomness and independence may be assumed for this test. We would typically satisfy assumptions prior to completing the analysis. Satisfy normality assumption for each of the four distributions Use boxplots and be sure to provide an explanation for each of the boxplots as it relates to satisfying normality. Refer to Page 6 of Handout Step 4: Satisfy equal variances assumption -Use Results Interval plot for differences of means Grouping information For the Tukey interpretation, discuss which pairs of mean GPAs are different and identify the class standing with the highest and low mean score for each significant pair. Step 3: Satisfy Assumptions for ANOVA test: Assumptions you will need to satisfy for your homework. Randomness and independence may be assumed for this test. We would typically satisfy assumptions prior to completing the analysis. Satisfy normality assumption for each of the four distributions Use boxplots and be sure to provide an explanation for each of the boxplots as it relates to satisfying normality. Refer to Page 6 of Handout Step 4: Satisfy equal variances assumption -Use six step process and p-values to satisfy assumption of equal variances. Set up six step and test variances. Refer to PAGE 1 OF HANDOUT. \begin{tabular}{|l||l|} \hline Be sure to set alpha to 90for & Test for Equal Variances: Options \\ Levenes' test of equal variances & Confidence level: \end{tabular}

Step by Step Solution

There are 3 Steps involved in it

1 Expert Approved Answer
Step: 1 Unlock blur-text-image
Question Has Been Solved by an Expert!

Get step-by-step solutions from verified subject matter experts

Step: 2 Unlock
Step: 3 Unlock

Students Have Also Explored These Related General Management Questions!