

Question: Please help me answer Part A. Thank you! Part A: Ratio Analysis (Week 3 Milestone) Attached are the financial statements for Smith Company, Inc. Use
Please help me answer Part A. Thank you!
Part A: Ratio Analysis (Week 3 Milestone)
Attached are the financial statements for Smith Company, Inc. Use the financial statements to answer the questions below
- Calculate and interpret the return on assets using the Dupont Method for the four years of data.
- Calculate and interpret the return on equity using the Modified Dupont Method all four years of data.
Information for calculating the ROA and ROE using the Dupont Method for three competitors to Smith Company, Inc. is also provided below. You will use this information in Part D.
Format Table
| (2018) | Competitor 1 | Competitor 2 | Competitor 3 |
| Net Profit Margin | 0.082 | 0.11 | 0.03 |
| Total Asset Turnover | 0.88 | 0.9 | 0.55 |
| ROA | 0.07216 | 0.099 | 0.0165 |
| FLM | 3.3 | 2.5 | 5.5 |
| ROE | 0.238128 | 0.2475 | 0.09075 |
Part B: Stock Valuation (Week 5 Milestone)
- Use the information provided to calculate the required rate of return on four stocks. Use both CAPM and the Dividend Discount Model. The market return is expected to be 8.5% and the risk-free rate is 2.0%.
Format Table
| Smith Company, Inc. | Competitor 1 | Competitor 2 | Competitor 3 | |
| Beta | 1.4 | 1.7 | 1.2 | 0.9 |
| Dividend | $2.00 | $3.25 | $2.00 | $1.25 |
| Price | $26.00 | $33.00 | $45.00 | $20.00 |
| Growth | 3.5% | 3.5% | 5.5% | 1.5% |
Part C: Dividend Policy
- Use the information provided to discuss the dividend policy of the four listed firms over the past four years.
Format Table
| 2018 | 2017 | 2016 | 2015 | ||
| Smith Company, Inc. | |||||
| Dividend | $2.00 | $2.00 | $2.00 | $2.00 | |
| Net Income | $3,978,000 | $4,931,000 | $5,220,000 | $5,652,000 | |
| Competitor 1 | |||||
| Dividend | $3.25 | $0.75 | $1.20 | $1.00 | |
| Net Income | $6,111,000 | $5,408,000 | $5,576,000 | $5,456,000 | |
| Competitor 2 | |||||
| Dividend | $2.50 | $2.50 | $2.00 | $1.00 | |
| Net Income | $5,547,000 | $5,160,000 | $4,823,000 | $4,637,000 | |
| Competitor 3 | |||||
| Dividend | $1.25 | $0.55 | $0.55 | $0.55 | |
| Net Income | $4,543,000 | $3,786,000 | $3,711,000 | $3,657,000 |
Part D: Analysis
- You are working as a financial analyst. Your manager has asked you to prepare a presentation on whether Smith Company, Inc. is a good investment opportunity. Prepare a presentation, a minimum of one slide for each part, summarizing your results. You should submit either an Excel or Word document showing your work for each part
Given Financial Information for Smith Company Inc.
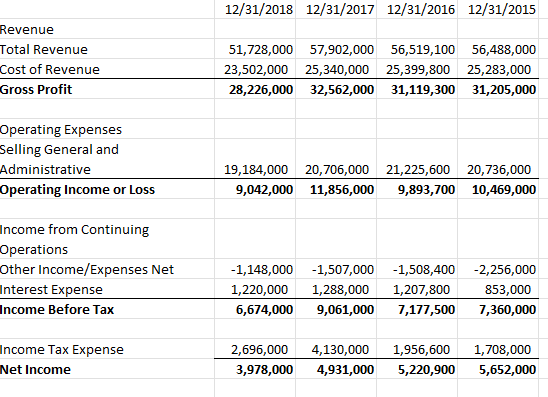
\begin{tabular}{l|c|c|c|c|} \hline & 12/31/2018 & 12/31/2017 & 12/31/2016 & 12/31/2015 \\ \hline Revenue & & & & \\ \hline Total Revenue & 51,728,000 & 57,902,000 & 56,519,100 & 56,488,000 \\ \hline Cost of Revenue & 23,502,000 & 25,340,000 & 25,399,800 & 25,283,000 \\ \hline Gross Profit & 28,226,000 & 32,562,000 & 31,119,300 & 31,205,000 \\ \hline & & & & \\ \hline Operating Expenses & & & & \\ \hline Selling General and & & & & \\ \hline Administrative & & & & \\ \hline Operating Income or Loss & 9,042,000 & 11,856,000 & 9,893,700 & 10,469,000 \\ \hline & & & & \\ \hline Income from Continuing & & & & \\ \hline & & & & \\ \hline Operations & & & & \\ \hline Other Income/Expenses Net & 1,148,000 & 1,507,000 & 1,508,400 & 2,256,000 \\ \hline Interest Expense & 1,220,000 & 1,288,000 & 1,207,800 & 853,000 \\ \hline Income Before Tax & 6,674,000 & 9,061,000 & 7,177,500 & 7,360,000 \\ \hline & & & & \\ \hline \end{tabular}
Step by Step Solution
There are 3 Steps involved in it

Get step-by-step solutions from verified subject matter experts