

Question: Please help me ASAP Use the PowerPoint frame Quantitative vs. Qualitative table format Given Above. Rreate a new table of 25 examples of data items
Please help me ASAP
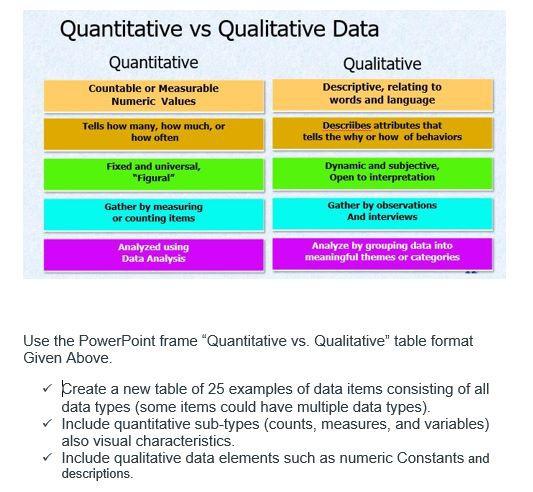
Use the PowerPoint frame "Quantitative vs. Qualitative" table format Given Above. Rreate a new table of 25 examples of data items consisting of all data types (some items could have multiple data types). Include quantitative sub-types (counts, measures, and variables) also visual characteristics. Include qualitative data elements such as numeric Constants and descriptions
Step by Step Solution
There are 3 Steps involved in it
1 Expert Approved Answer
Step: 1 Unlock

Question Has Been Solved by an Expert!
Get step-by-step solutions from verified subject matter experts
Step: 2 Unlock
Step: 3 Unlock