

Question: Please help me Back to Assignment Attempts 1.4 Keep the Highest 1.4 l 3 9 . The long-run supply curve in different cost industries The
Please help me
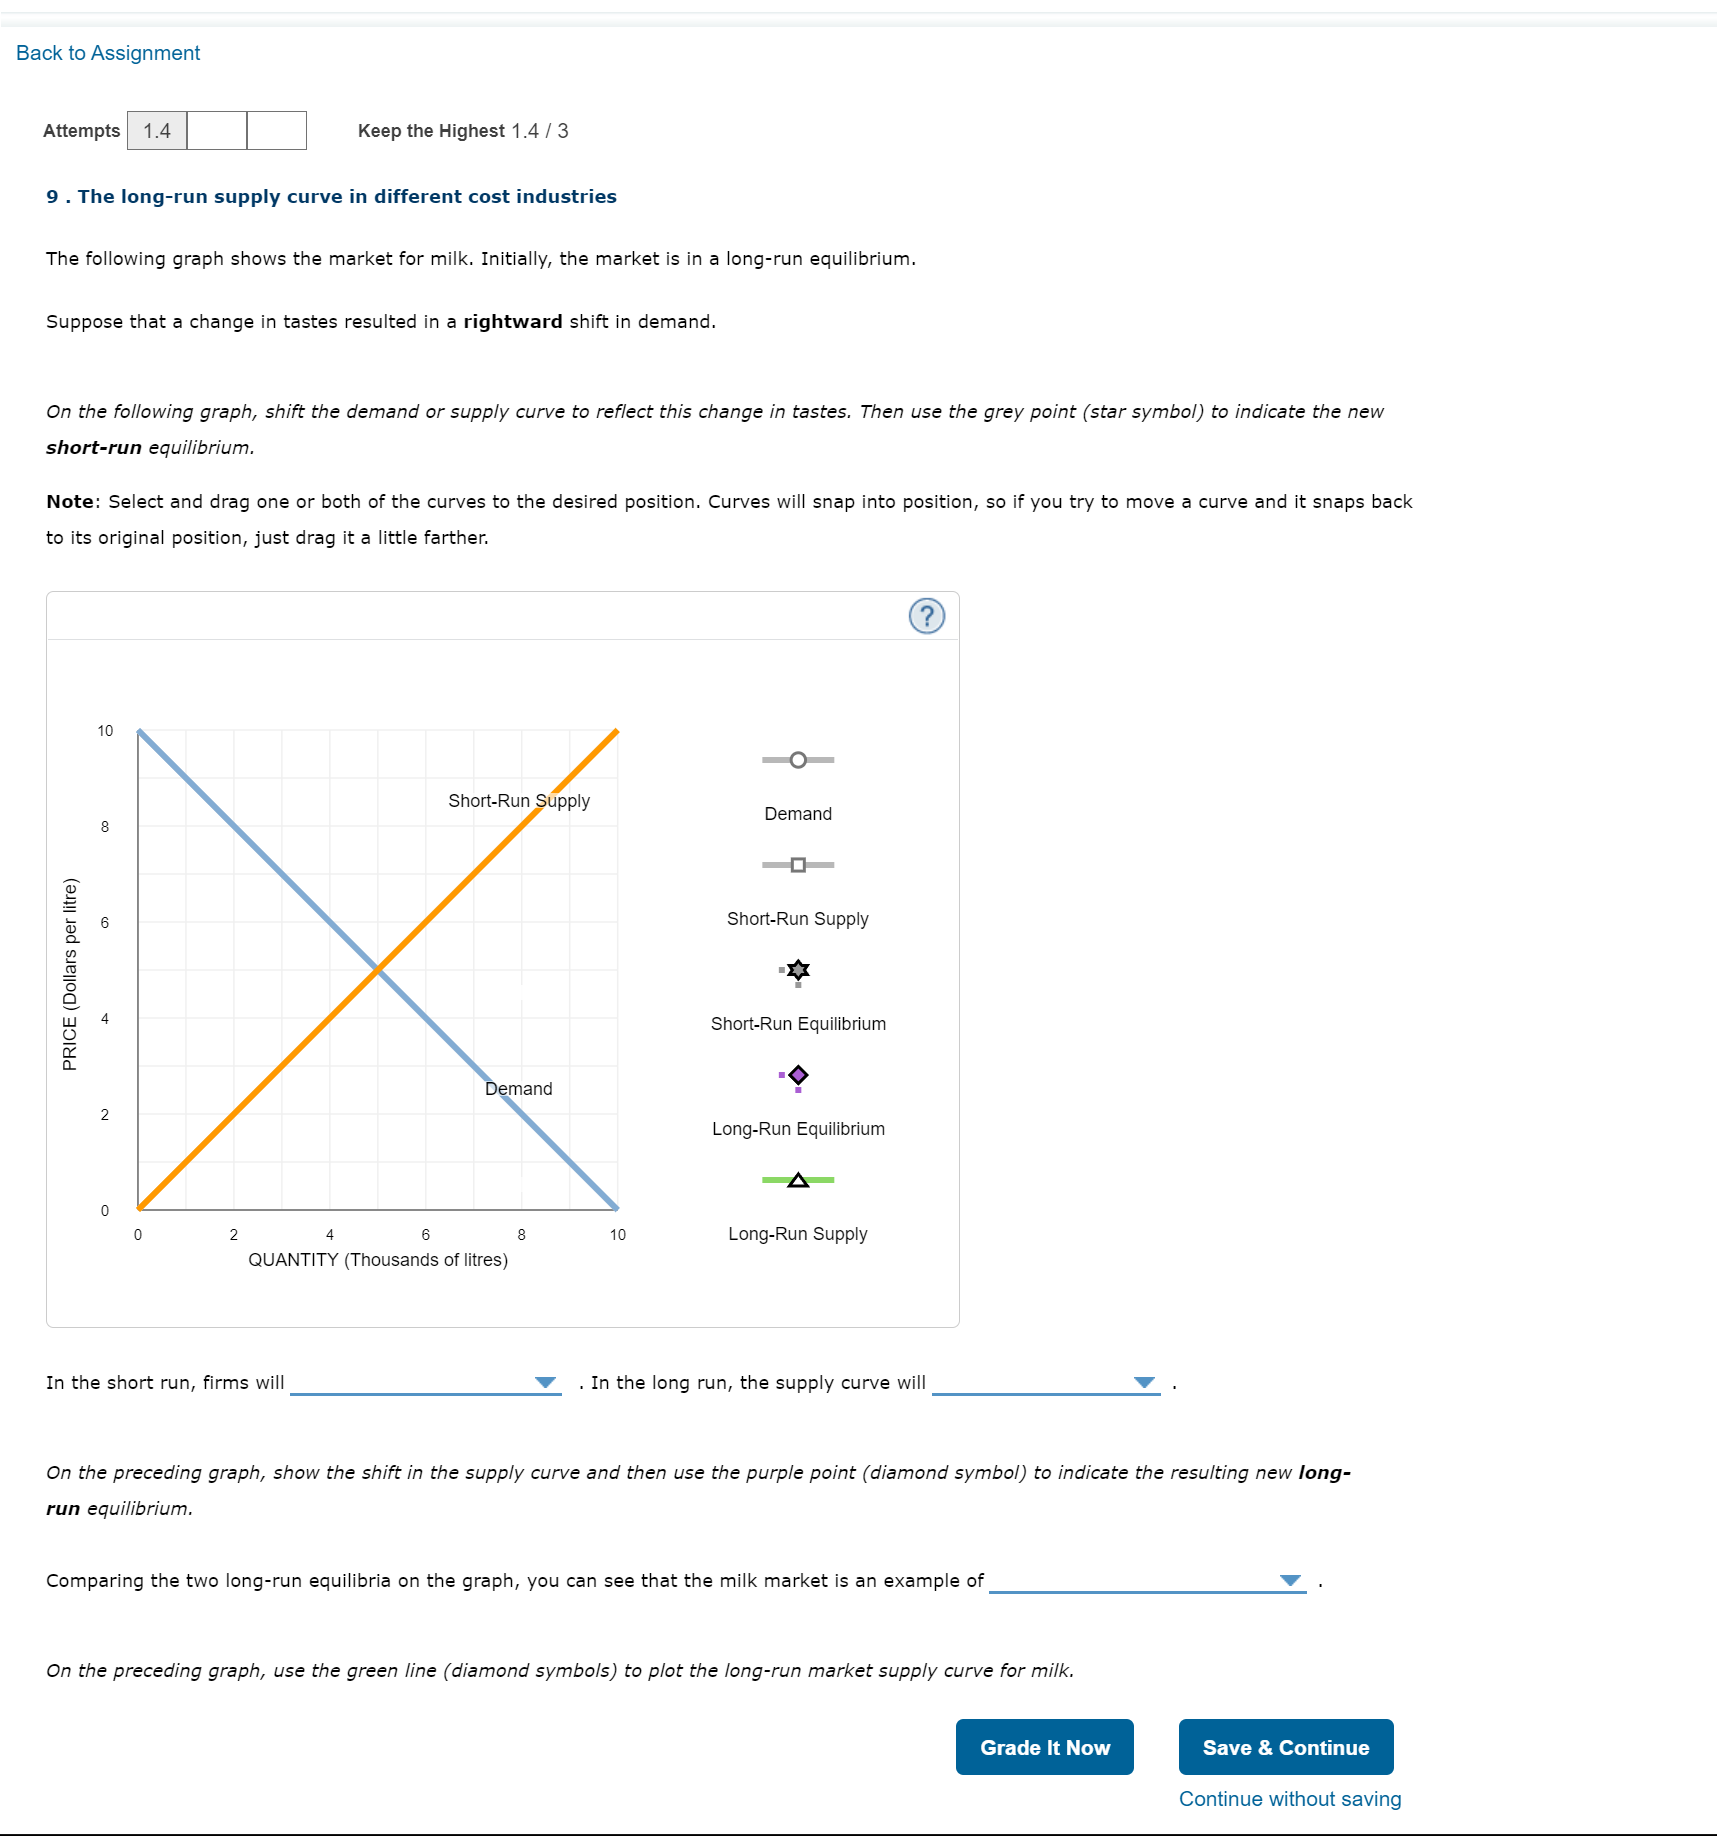
Back to Assignment Attempts 1.4 Keep the Highest 1.4 l 3 9 . The long-run supply curve in different cost industries The following graph shows the market for milk. Initially, the market is in a longrun equilibrium. Suppose that a change in tastes resulted in a rightward shi in demand. On the following graph, shift the demand or supply curve to reflect this change in tastes. Then use the grey point (star symbol) to indicate the new short-run equilibrium. Note: Select and drag one or both of the curves to the desired position. Curves will snap into position, so if you try to move a curve and it snaps hack to its original position, just drag it a little farther. 10 + Sh rt-R S l a D U" upp y Demand _n_ E E 5 Short-Run Supply EL E at E I Q. g 4 Short-Run Equilibrium E '? 2 Long-Run Equilibrium + 0 0 2 4 6 8 10 Long-Run Supply QUANTITY (Thousands of litres) In the short run, firms will V . In the long run, the supply curve will V . On the preceding graph, show the shift in the supply curve and then use the purple point (diamond symbol) to indicate the resulting new long- run equilibrium. Comparing the two longrun equilibria on the graph, you can see that the milk market is an example of V . On the preceding graph, use the green line ( diamond symbols) to plot the long-run market supply curve for milk. Continue without saving
Step by Step Solution
There are 3 Steps involved in it

Get step-by-step solutions from verified subject matter experts