

Question: Please help me calculate the data in Table 2 and answer the questions for it with graphs. The data calculated in table 2 will then
Please help me calculate the data in Table 2 and answer the questions for it with graphs. The data calculated in table 2 will then be used to calculate the data needed for Table 3. All information is provided and thank you so much for your time!
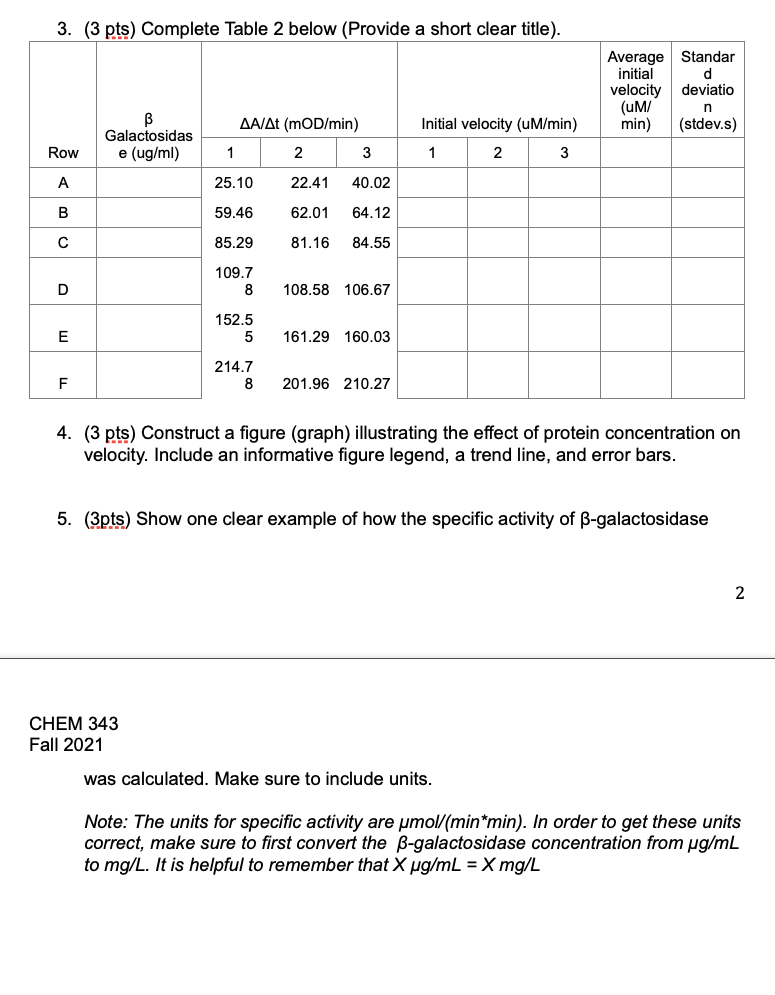
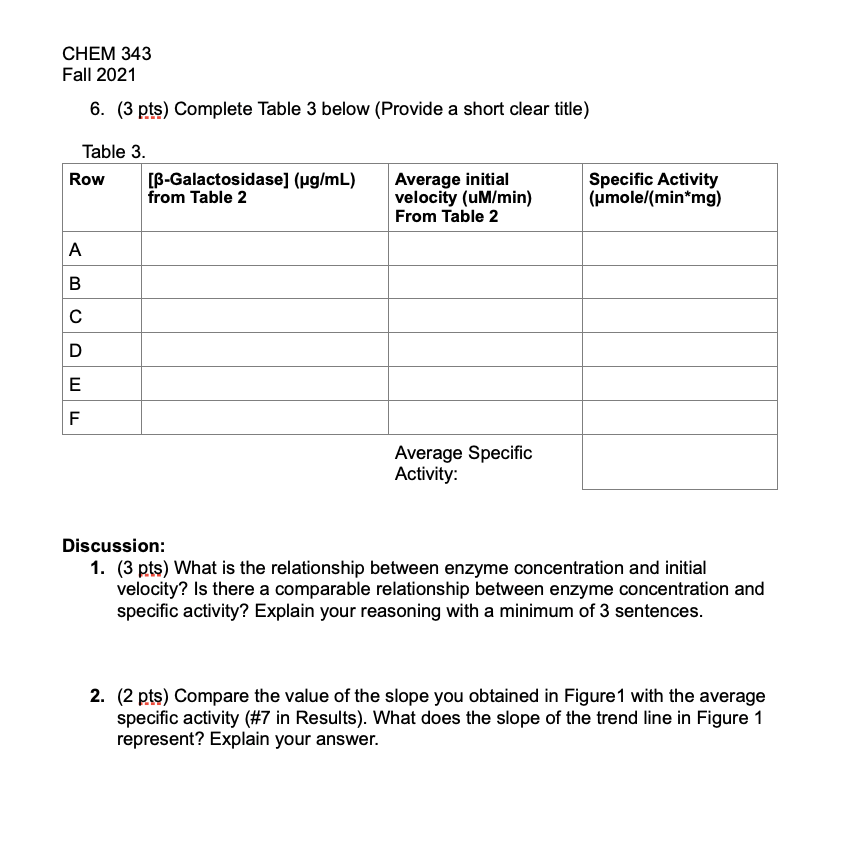
3. (3 pts) Complete Table 2 below (Provide a short clear title). Average Standar initial d velocity deviatio (UM/ min) (stdev.s) B Galactosidas e (ug/ml) AA/At (mOD/min) 2 3 Initial velocity (UM/min) 1 2 3 Row 1 3 A 25.10 22.41 40.02 B 59.46 62.01 64.12 85.29 81.16 84.55 109.7 8 D 108.58 106.67 152.5 5 E 161.29 160.03 214.7 8 F 201.96 210.27 4. (3 pts) Construct a figure (graph) illustrating the effect of protein concentration on velocity. Include an informative figure legend, a trend line, and error bars. 5. (3pts) Show one clear example of how the specific activity of B-galactosidase 2 CHEM 343 Fall 2021 was calculated. Make sure to include units. Note: The units for specific activity are pmol/min*min). In order to get these units correct, make sure to first convert the B-galactosidase concentration from pg/mL to mg/L. It is helpful to remember that X ug/mL = X mg/L CHEM 343 Fall 2021 6. (3 pts) Complete Table 3 below (Provide a short clear title) Table 3. Row [B-Galactosidase] (ug/mL) from Table 2 Average initial velocity (M/min) From Table 2 Specific Activity (umole/(min*mg) A B D E Average Specific Activity: Discussion: 1. (3 pts) What is the relationship between enzyme concentration and initial velocity? Is there a comparable relationship between enzyme concentration and specific activity? Explain your reasoning with a minimum of 3 sentences. 2. (2 pts) Compare the value of the slope you obtained in Figure 1 with the average specific activity (#7 in Results). What does the slope of the trend line in Figure 1 represent? Explain your
Step by Step Solution
There are 3 Steps involved in it

Get step-by-step solutions from verified subject matter experts