

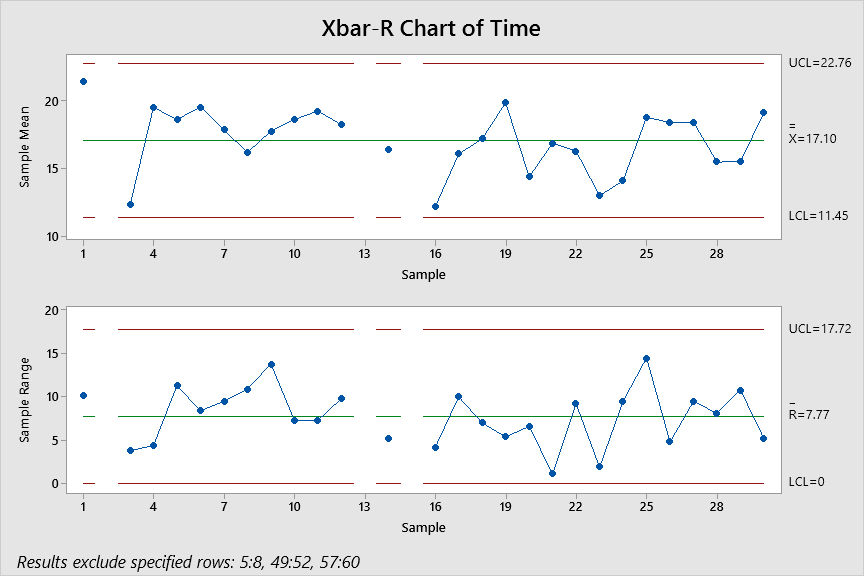
Question: Please help me estimate the process mean and process standard deviation of the stable process. Xbar-R Chart of Time UCL=22.76 20 X=17.10 Sample Mean 4
Please help me estimate the process mean and process standard deviation of the stable process.
Step by Step Solution
There are 3 Steps involved in it
1 Expert Approved Answer
Step: 1 Unlock

Question Has Been Solved by an Expert!
Get step-by-step solutions from verified subject matter experts
Step: 2 Unlock
Step: 3 Unlock