

Question: please help me explain why the answer is that. (3-4). The following Q-Q plots compare the daily returns on S&P500 index with the normal distribution
please help me explain why the answer is that.
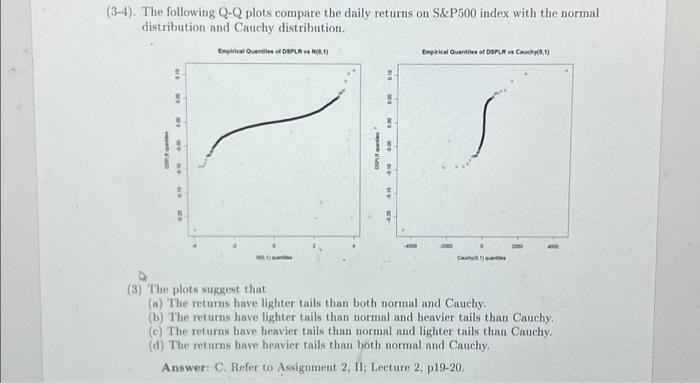
(3-4). The following Q-Q plots compare the daily returns on S&P500 index with the normal distribution and Cauchy distribution. (3) The plots suggest that (a) The returns have lighter tails than both normal and Cauchy. (b) The returns have fighter tails than normal and heavier tails than Cauchy, (c) The returns have heavier tails than normal and lighter tails than Cauchy. (d) The returns have heavier tails than both normal and Cauchy. Answer: C. Refer to Assignment 2, II; Lecture 2, p19-20
Step by Step Solution
There are 3 Steps involved in it
1 Expert Approved Answer
Step: 1 Unlock

Question Has Been Solved by an Expert!
Get step-by-step solutions from verified subject matter experts
Step: 2 Unlock
Step: 3 Unlock