

Question: Please help me here is my spreadsheet- I have the most part done but I'm stuck in the Census Regions and Analysis . https://onedrive.live.com/edit.aspx?resid=59E16BB1E510CBDF!1134&ithint=file%2cxlsx&authkey=!ADdWCjbP6MyPAE0 Introduction
Please help me
here is my spreadsheet- I have the most part done but I'm stuck in the Census Regions and Analysis .
https://onedrive.live.com/edit.aspx?resid=59E16BB1E510CBDF!1134&ithint=file%2cxlsx&authkey=!ADdWCjbP6MyPAE0
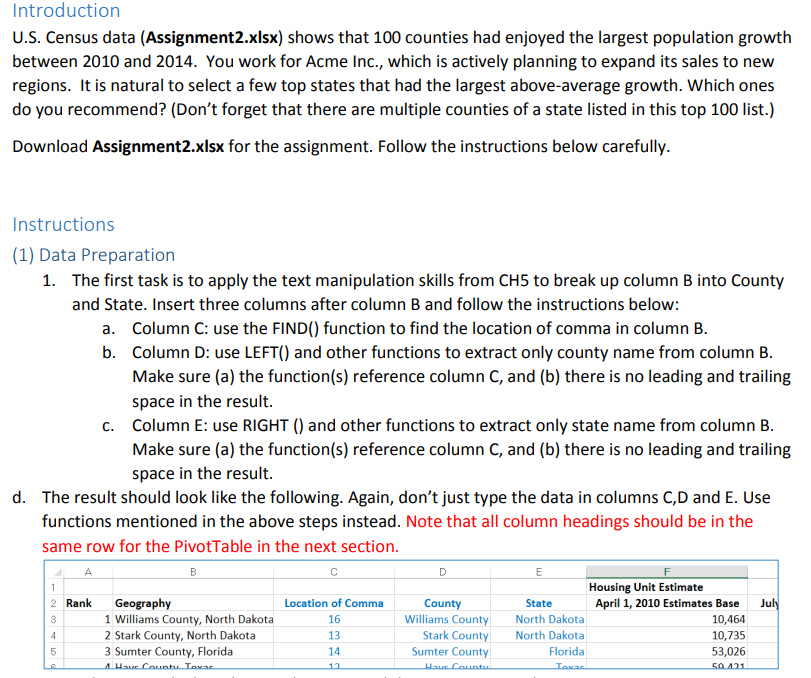
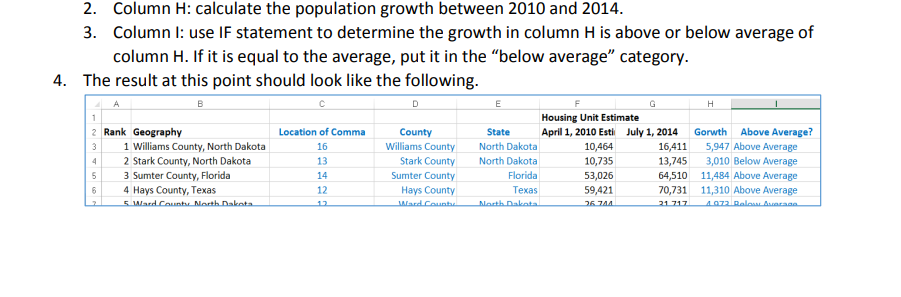
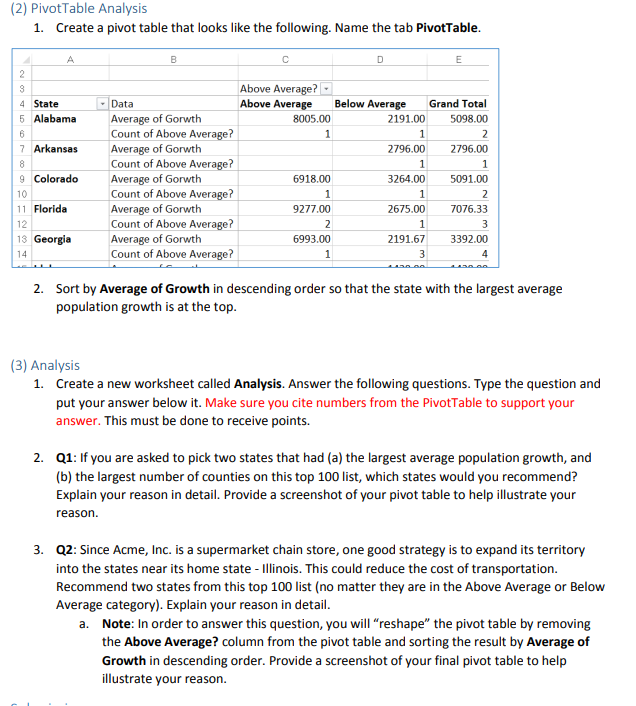
Introduction U.S. Census data (Assignment2.xIsx) shows that 100 counties had enjoyed the largest population growth between 2010 and 2014. You work for Acme Inc., which is actively planning to expand its sales to new regions. It is natural to select a few top states that had the largest above-average growth. Which ones do you recommend? (Don't forget that there are multiple counties of a state listed in this top 100 list.) Download Assignment2.xisx for the assignment. Follow the instructions below carefully. Instructions (1) Data Preparation 1. The first task is to apply the text manipulation skills from CH5 to break up column B into County and State. Insert three columns after column B and follow the instructions below: a. Column C: use the FIND() function to find the location of comma in column B. b. Column D: use LEFT() and other functions to extract only county name from column B. Make sure (a) the function(s) reference column C, and (b) there is no leading and trailing space in the result. c. Column E: use RIGHT () and other functions to extract only state name from column B. Make sure (a) the function(s) reference column C, and (b) there is no leading and trailing space in the result. d. The result should look like the following. Again, don't just type the data in columns C,D and E. Use functions mentioned in the above steps instead. Note that all column headings should be in the same row for the PivotTable in the next section. A B C D E 1 Housing Unit Estimate 2 Rank Geography Location of Comma County State April 1, 2010 Estimates Base July 3 1 Williams County, North Dakota 16 Williams County North Dakota 10,464 2 Stark County, North Dakota 13 Stark County North Dakota 10,735 3 Sumter County, Florida 14 Sumter County Florida 53,026 1 Have Counter Touse 17 Hour Counter 50 4312. Column H: calculate the population growth between 2010 and 2014. 3. Column I: use IF statement to determine the growth in column H is above or below average of column H. If it is equal to the average, put it in the "below average" category. 4. The result at this point should look like the following. A B D E F G H Housing Unit Estimate 2 Rank Geography Location of Comma County State April 1, 2010 Esti July 1, 2014 Gorwth Above Average? 1 Williams County, North Dakota 16 Williams County North Dakota 10,464 16,411 5,947 Above Average 2 Stark County, North Dakota 13 Stark County North Dakota 10,735 13,745 3,010 Below Average 3 Sumter County, Florida 14 Sumter County Florida 53,026 64,510 11,484 Above Average 4 Hays County, Texas 12 Hays County Texas 59,421 70,731 11,310 Above Average 5 Ward Counter North Dakota Ward Counts North Dakota 36 741 31 717 4 073 Ralow Avarana{2] PivotTable Analysis 1. Create a pivot table that looks like the following. Name the tab PlvotTahIe. 'J I 2 Above Average? . 4 State 7 Data Above Average Below Average Grand Total F- Alahalna Average of Gory-sh 3005.00 2191.00 $098.00 I'- Count of Above Average? 1 1 2 '- Ar'kansa: Average of (5th H9600 EEEUD a Count of Above Average? 1 1 'I Colorado Average of (5th 5918.00 3254.00 5091.00 1c Count of Above Average? 1 1 2 11 Florida Average of Gorwth 93100 2615.00 ?0?6.33 1-_ Count of Above Average? 2 1 3 1': Georgia Average of Gorwth 5993.00 2191.6? 3392.0) 14 Count of Above Average? 1 3 :1 L. l n l 2. Sort by Average of Growth in descending order so that the state with the largest average population growth is at the top. {3] Analysis 1. Create a new worksheet called Analysis. Answer the following questions. Type the question and put your answer below it. Make sure you cite numbers from the PivotTable to support your answer. This must be done to receive points. 2. Q1: If you are asked to pick two states that had [a] the largest average population growth, and lb: the largest number of oounties on this top 100 list; which states would you recommend? Explain your reason in detail. Provide a screenshot oi your pivot table to help illustrate your reason. 3. Q2: Sinoe Acme} Inc. is a supermarket chain store, one good strategy is to expand its territory into the states near its home state Illinois. This could reduce the cost of transportation. Recommend two states from this top 100 list {no matter they are in the Above Average or Below Average category]. Explain your reason in detail. a. Note: In order to answer this question, you will "reshape\" the pivot table by removing the Above Average? oolumn from the pivot table and sorting the result by Average of Growth in desoending order. Provide a screenshot of your final pivot table to help illustrate your reason
Step by Step Solution
There are 3 Steps involved in it

Get step-by-step solutions from verified subject matter experts