

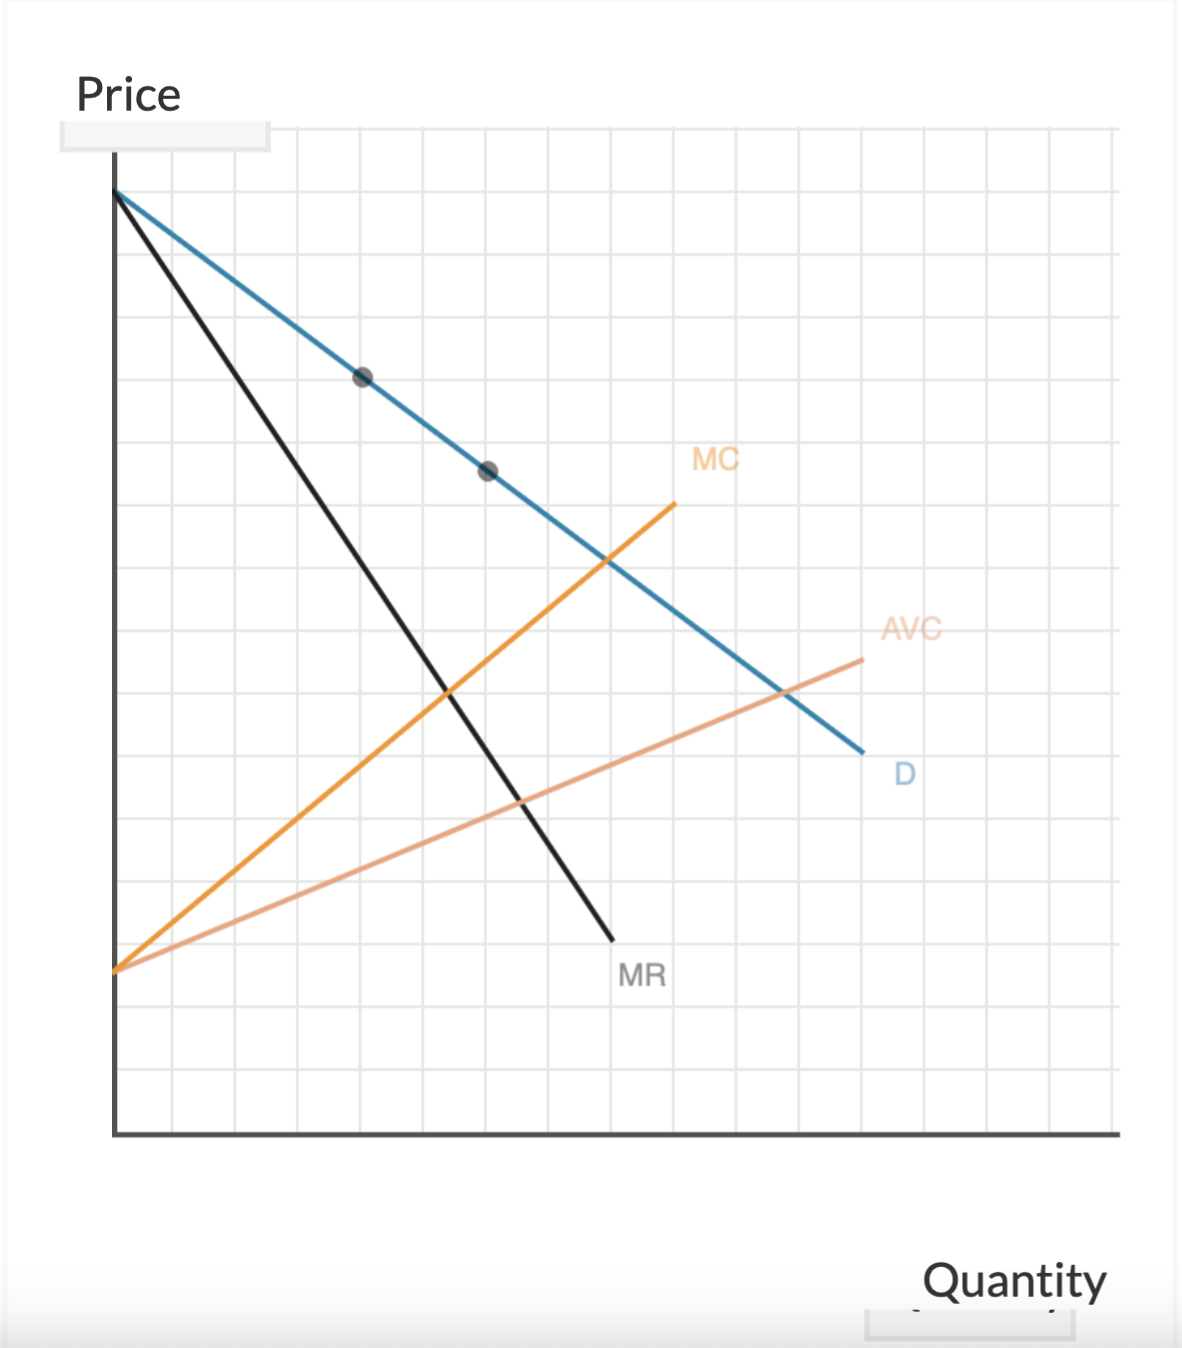
Question: Please help me , I am stuck. Step 1 : The graph shows the demand ( D ) , marginal cost ( MC ) ,
Please help me I am stuck. Step : The graph shows the demand D marginal cost MC marginal revenue MR and average variable cost AVC curves for a firm that is a price maker for its product. The MC and AVC curves slope upward because of limited space and resources for production activity: To increase output, the firm must bring older, lessreliable equipment out of storage, pay its workers extra for overtime hours, and so on
Step : Refer to the graph If the firm is able to practice price discrimination, using the two prices indicated by the two points indicated on the demand curve, use the area tool to outline the region that represents the net revenue revenue minus production costs, but ignoring fixed costs The lower boundary of the region should be slanted, and you should use the area tool only once to outline the area.
Price
Quantity
Step by Step Solution
There are 3 Steps involved in it
1 Expert Approved Answer
Step: 1 Unlock

Question Has Been Solved by an Expert!
Get step-by-step solutions from verified subject matter experts
Step: 2 Unlock
Step: 3 Unlock