Question: please help me indsrstand and master The data in the attached spreadsheet show the filling weights based on samples of 14.5 ounce cans of whole

please help me indsrstand and master please help me indsrstand and master The data in
The data in the attached spreadsheet show the filling weights based on samples of 14.5 ounce cans of whole peeled tomatoes. Ten samples were taken, each with 5 observations in each sample. The Control Chart Factors Table can be found above in question 1 of this guz. 1. Calculate the Upper and Lower Control Limits for the Xbar Chart 2. Calculate the Upper and Lower Control Limits for the R Chart 3. Develop the Xbar and R Control Charts in MS Excel 4. Comment on whether the process is in control or out of control Sample Observ. Observ. Observ. Observ. Observ. $ 14,34988 13.86116 14.62213 15.13824 15.09918 14.1549 13.65478 13.57654 14.01 19 14.11325 14.3365 14.31488 15.17132 14.45736 14.40692 15.33073 13.6938 14.76947 14.9511 15.45946 13.77791 14.07638 13.73921 14.31856 14.48376 13.21121 15.22384 13.86012 14.17321 14.87886 14.847 14.66132 14.03008 14.37953 14.56577 14.53612 14.91492 14.931 14.18173 14.0384 15.60284 15.22188 15.15195 14.55648 14.50098 14.72211 14.80895 14.60674 13.98653 15.1191 10 Page 1 of 1 168 words Focus 134 Que

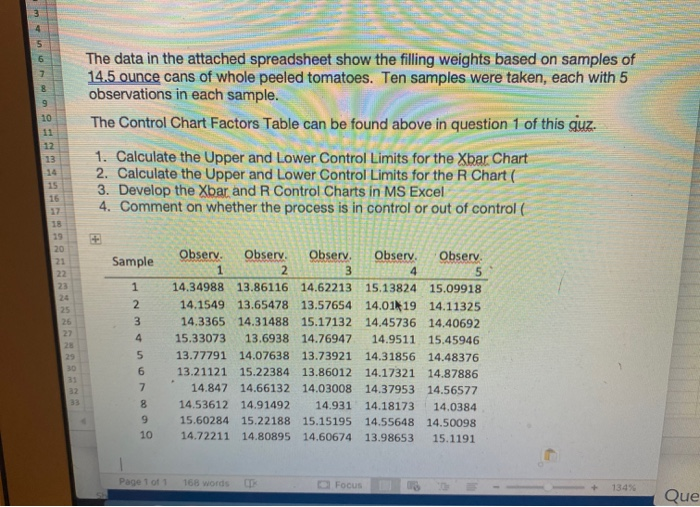
Step by Step Solution

There are 3 Steps involved in it

1 Expert Approved Answer
Step: 1 Unlock blur-text-image
Question Has Been Solved by an Expert!

Get step-by-step solutions from verified subject matter experts

Step: 2 Unlock
Step: 3 Unlock

Students Have Also Explored These Related General Management Questions!