

Question: Please help me of this python coding problem. The 32 teams in the National Football League (NFL) are worth, on average, 1.17billion,5percentmorethanlastyear.ThedatafileNFLTeamValue.csvshowstheannualrevenue(1.17billion,5percentmorethanlastyear.ThedatafileNFLTeamValue.csvshowstheannualrevenue( millions) and the
Please help me of this python coding problem.
The 32 teams in the National Football League (NFL) are worth, on average, 1.17billion,5percentmorethanlastyear.Thedatafile"NFLTeamValue.csv"showstheannualrevenue(1.17billion,5percentmorethanlastyear.Thedatafile"NFLTeamValue.csv"showstheannualrevenue( millions) and the estimated team value ($ millions) for the 32 NFL teams (forbes website, February 28, 2014).
Please read the data from "NFLTeamValue.csv" and complete the following tasks. Make sure that "NFLTeamValue.csv" is in your working directory. Pay attention to the format of the data and do not make any change to the data file.
Note: In total, there are 32 teams. Therefore, the data contains the entire population. Make sure you use appropriate formulars (for population, not for sample) when computing the values needed.
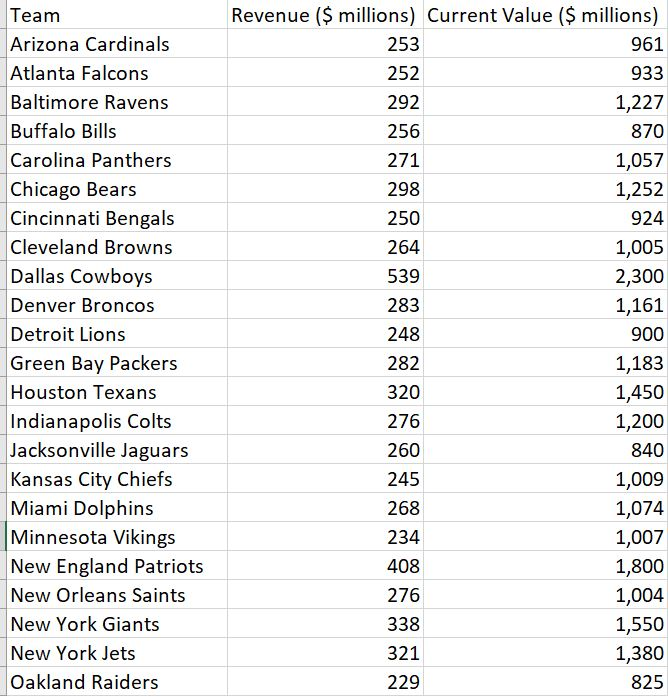
Here's the part of the data from 'csv.file'
Here's the coding questions, total is the 8 small quesitons.
# 2-1: Develop and display a histogram for the annual revenue with proper label/title/legend. # Choose an appropriate value for the number of bins.
# 2-2: Compute and display the following information for the annual revenue: # mean, median, variance, standard deviation, 1st and 3rd quartile, 10th and 90th percentile and IQR. # Don't simply print out a number. Make sure you clearly indicate what a number is. For example, "the mean of the annual revenue is"
# 2-3: Compute and display z-scores for Dallas Cowboys, Oakland Raiders, and Chicago Bears. (2 points) # And then print out the team names of all outliers based on z-score. # Read the textbook if you don't know how to determine outliers based on z-score.
# 2-4: Develop and display a box for the estimated team value with proper label/title/legend.
# 2-5: Compute and display the following information for the estimated team value: # mean, median, variance, standard deviation, 1st and 3rd quartile, 10th and 90th percentile and IQR.
# 2-6: Print out the team names of all outliers based on IQR. # Read the textbook if you don't know how to determine outliers based on IQR.
# 2-7: Develop a scatter diagram with Revenue on the horizontal axis and value on the vertical axis. # Briefly describe the relationship between the two variables?
# 2-8: Compute and display the population covariance and correlation coefficient between the two variables. # Briefly interpret the practical meaning of this correlation coefficient.
Thanks!!
Team Arizona Cardinals Atlanta Falcons Baltimore Ravens Buffalo Bills Carolina Panthers Chicago Bears Cincinnati Bengals Cleveland Browns Dallas Cowboys Denver Broncos Detroit Lions Green Bay Packers Houston Texans Indianapolis Colts Jacksonville Jaguars Kansas City Chiefs Miami Dolphins Minnesota Vikings New England Patriots New Orleans Saints New York Giants New York Jets Oakland Raiders Revenue ($ millions) Current Value ($millions) 961 933 1,227 870 1,057 1,252 924 1,005 2,300 1,161 900 1,183 1,450 1,200 840 1,009 1,074 1,007 1,800 1,004 1,550 1,380 825 253 252 292 256 271 298 250 264 539 283 248 282 320 276 260 245 268 234 408 276 338 321 229
Step by Step Solution
There are 3 Steps involved in it

Get step-by-step solutions from verified subject matter experts