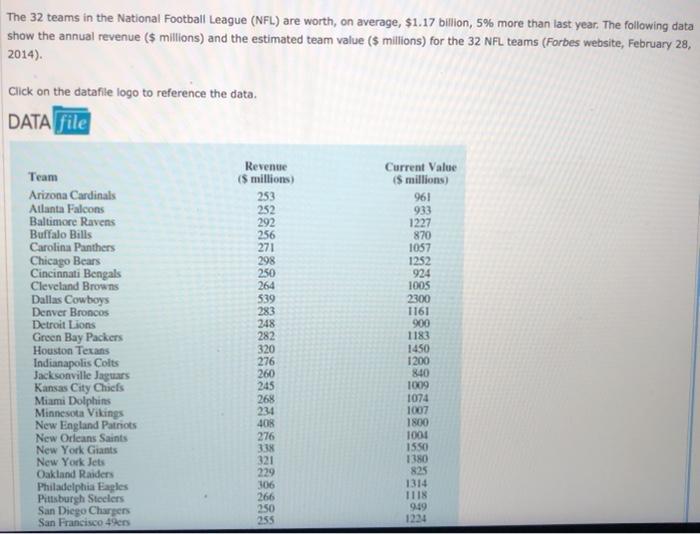
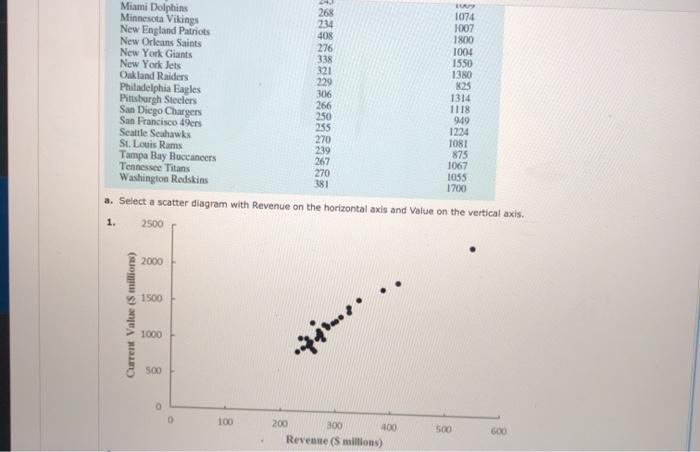
Question: The 32 teams in the National Football League (NFL) are worth, on average, $1.17 billion, 5% more than last year. The following data show the

The 32 teams in the National Football League
The 32 teams in the National Football League (NFL) are worth, on average, $1.17 billion, 5% more than last year. The following data show the annual revenue ($ millions) and the estimated team value ($ millions) for the 32 NFL teams (Forbes website, February 28, 2014). Click on the datafile logo to reference the data. DATA file Team Arizona Cardinals Atlanta Falcons Baltimore Ravens Buffalo Bills Carolina Panthers Chicago Bears Cincinnati Bengals Cleveland Browns Dallas Cowboys Denver Broncos Detroit Lions Green Bay Packers Houston Texans Indianapolis Colts Jacksonville Jaguars Kansas City Chics Miami Dolphins Minnesota Vikings New England Patriots New Orleans Saints New York Giants New York Jets Oakland Raiders Philadelphia Eagles Pittsburgh Steelers San Diego Chargers San Francisco 49ers Revenue (5 millions) 253 252 292 256 271 298 250 264 539 283 248 282 320 276 260 245 268 234 408 276 338 321 229 306 266 250 255 Current Value (5 millions) 961 933 1227 870 1057 1252 924 1005 2300 1161 900 1183 1450 1200 840 1009 1074 1007 1800 1001 1550 1380 825 1314 1118 9.49 1234 LU Miami Dolphins Minnesota Vikings 268 1074 234 New England Patriots 1007 408 1800 New Orleans Saints 276 1004 New York Giants 338 New York Jets 1550 321 1380 Oakland Raiders 209 825 Philadelphia Eagles 306 1314 Pittsburgh Steelers 266 1118 San Diego Chargers San Francisco 49ers 250 9:49 255 Seattle Seahawks 1224 270 St. Louis Rams 1081 239 875 Tampa Bay Buccaneers 267 1067 Tennessee Titans Washington Redskins 1055 1700 5. Select a scatter diagram with Revenue on the horizontal axis and Value on the vertical axis. 1. 2500 270 381 2000 1500 Current Value (5 millions) 1000 -4.ro 500 100 500 200 300 400 Revenge (5 millions) 600 2. 2500 2000 1500 Current Value (5 millions) 1000 500 0 0 100 200 300 400 Revenue (S millions) 500 600 3. 2500 2000 1500 Current Value (5 millions) 1000 ff..... 500 100 200 300 400 Revenue (S millions) 500 600 Revenue (S millions) 4. 2500 2000 1500 Current Value (5 millions) 1000 odmor. 500 0 600 100 200 300 400 500 Revenue (5 millions) Select the correct scatter diagram: Select your answer - Does there appear that there is any relationship between the two variables? - Select your answer b. What is the sample correlation coefficient (to 2 decimals)? What can you say about the strength of the relationship between Revenue and Value? Select your

Step by Step Solution

There are 3 Steps involved in it

1 Expert Approved Answer
Step: 1 Unlock blur-text-image
Question Has Been Solved by an Expert!

Get step-by-step solutions from verified subject matter experts

Step: 2 Unlock
Step: 3 Unlock

Students Have Also Explored These Related General Management Questions!