

Question: Please help me out, how to add an error bar with my code to look like the screenshot below? By using MATLAB clc clear all;
Please help me out, how to add an error bar with my code to look like the screenshot below? By using MATLAB
clc
clear all;
close all;
D = 60*0.001;
r = D/2;
g = 9.81;
P1 = 0.6*100000;
FR1 = (10/15.76)*0.001;
W1 = [350 550 750 950 1150 1350]*g*0.001;
S1 = [0.01 0.05 0.11 0.21 0.38 0.54]*g;
N1 = [1177 1043 909 812 745 670]*0.104719755;
P2 = 0.8*100000;
FR2 = (10/19.31)* 0.001;
W2 = [350 550 750 950 1150 1350]*g*0.001;
S2 = [0.01 0.05 0.11 0.20 0.32 0.50]*g;
N2 = [1377 1169 985 812 650 452]*0.104719755;
P3 = 1.0*100000;
FR3 = (10/22.80)* 0.001;
W3 = [350 550 750 950 1150 1350]*g*0.001;
S3 = [0.01 0.03 0.08 0.16 0.30 0.49]*g;
N3 = [1476 1196 881 660 442 255]*0.104719755;
P4 = 1.2*100000;
FR4 = (10/27.30)* 0.001;
W4 = [350 550 750 950 1150 1350]*g*0.001;
S4 = [0.02 0.05 0.10 0.20 0.33 0.54]*g;
N4 = [1542 1220 889 539 242 67]*0.104719755;
P5 = 1.4*100000;
FR5 = (10/33.35)* 0.001;
W5 = [350 550 750 950 1150 1350]*g*0.001;
S5 = [0.01 0.03 0.08 0.22 0.44 0.62]*g;
N5 = [1500 1066 580 351 120 0]*0.104719755;
T1 = (W1-S1)*r;
T2 = (W2-S2)*r;
T3 = (W3-S3)*r;
T4 = (W4-S4)*r;
T5 = (W5-S5)*r;
%% power input, Pi
Pi1 = P1*FR1;
Pi2 = P2*FR2;
Pi3 = P3*FR3;
Pi4 = P4*FR4;
Pi5 = P5*FR5;
%% power output, Po, versus wheel speed
Po1 = T1 .* N1;
Po2 = T2 .* N2;
Po3 = T3 .* N3;
Po4 = T4 .* N4;
Po5 = T5 .* N5;
%% efficiency, , versus wheel speed
eff1 = (Po1/Pi1)*100;
eff2 = (Po2/Pi2)*100;
eff3 = (Po3/Pi3)*100;
eff4 = (Po4/Pi4)*100;
eff5 = (Po5/Pi5)*100;
errorbar(x, y(:,i), err(:,i), '.');
plot (N1, eff1,'-gs','markersize',5,'markerfacecolor','b','linewidth',3);
hold on
plot (N2, eff2, '-bs','markersize',5,'markerfacecolor','k','linewidth',3);
plot (N3, eff3, '-ms','markersize',5,'markerfacecolor','g','linewidth',3);
plot (N4, eff4, '-rs','markersize',5,'markerfacecolor','m','linewidth',3);
plot (N5, eff5, '-ks','markersize',5,'markerfacecolor','r','linewidth',3);
hold off
grid on
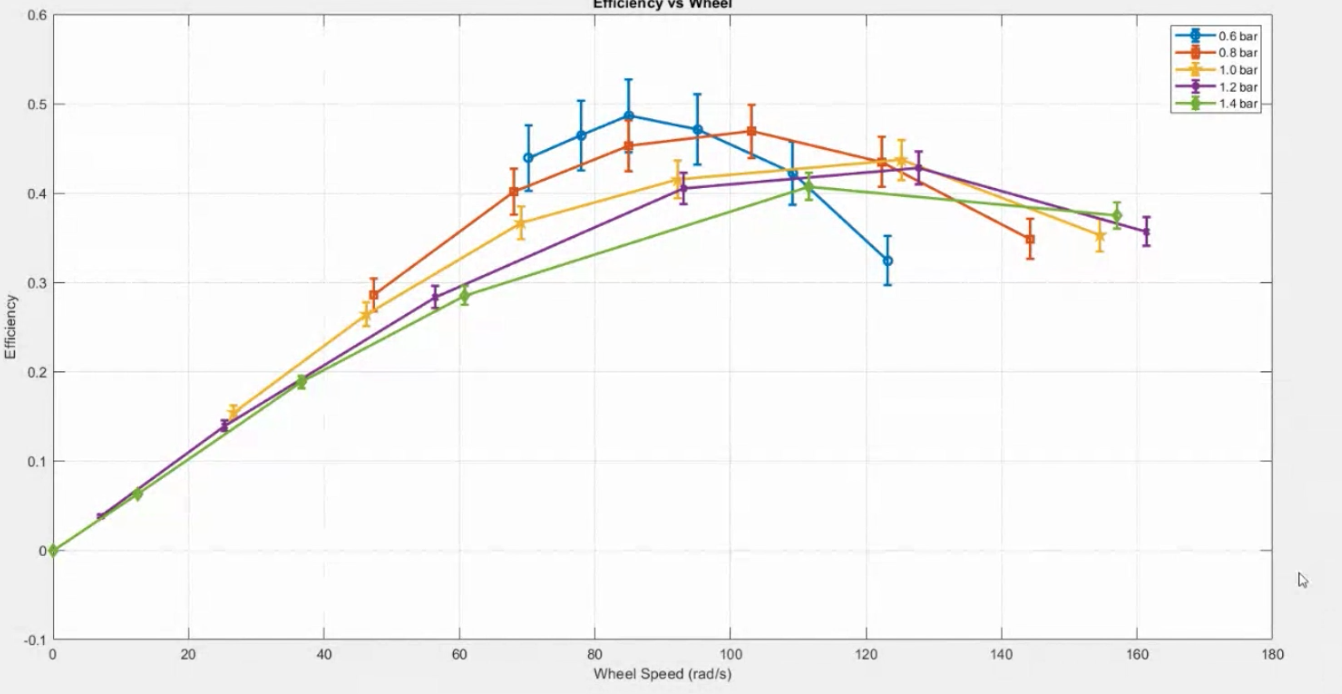
legend('0.6 bar','0.8 bar','1.0 bar','1.2 bar','1.4 bar')
xlabel('Wheel Speed (Rad/s)')
ylabel('Efficiency (%)')
Efficiency vs Wheel 0.6 -0.6 bar 0.8 bar 1.0 bar 1.2 bar 0.5 1.4 bar 0.4 0.3 1.3 Efficiency 0.2 0.1 0 -0.1 0 20 40 60 120 140 160 180 80 100 Wheel Speed (rad/s) Efficiency vs Wheel 0.6 -0.6 bar 0.8 bar 1.0 bar 1.2 bar 0.5 1.4 bar 0.4 0.3 1.3 Efficiency 0.2 0.1 0 -0.1 0 20 40 60 120 140 160 180 80 100 Wheel Speed (rad/s)
Step by Step Solution
There are 3 Steps involved in it

Get step-by-step solutions from verified subject matter experts