

Question: Please help me out! My excel isn't working, please help me make the graphs in excel! Thank you so much for your time! Data Table
Please help me out! My excel isn't working, please help me make the graphs in excel! Thank you so much for your time!
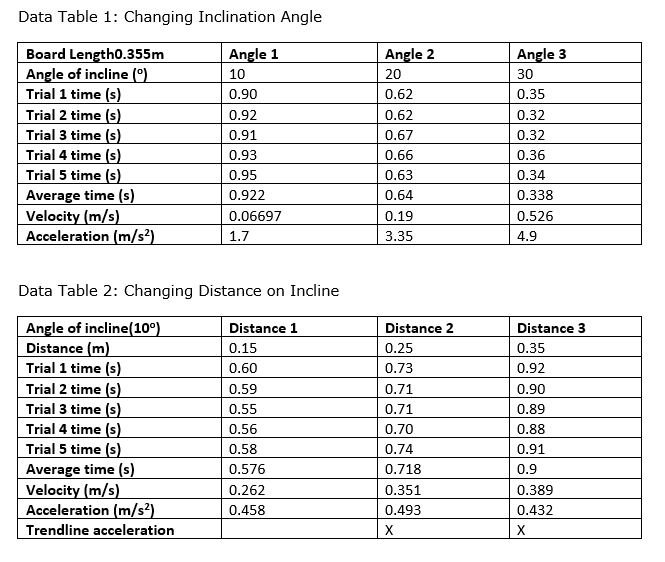
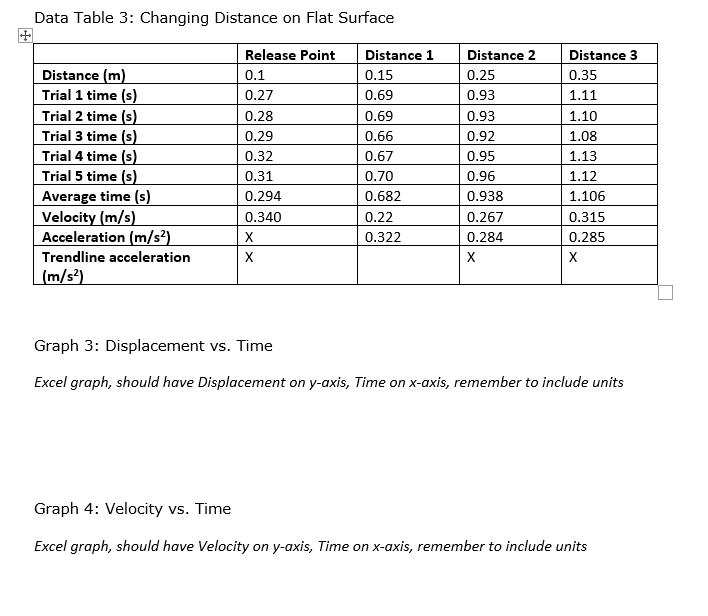
Data Table 1: Changing Inclination Angle Board Length0.355m Angle 1 Angle 2 Angle 3 Angle of incline (") 10 20 30 Trial 1 time (s) 0.90 0.62 0.35 Trial 2 time (s) 0.92 0.62 0.32 Trial 3 time (s) 0.91 0.67 0.32 Trial 4 time (s) 0.93 0.66 0.36 Trial 5 time (s) 0.95 0.63 0.34 Average time (s) 0.922 0.64 0.338 Velocity (m/s) 0.06697 0.19 0.526 Acceleration (m/s?) 1.7 3.35 4.9 Data Table 2: Changing Distance on Incline Angle of incline(10") Distance 1 Distance 2 Distance 3 Distance (m) 0.15 0.25 0.35 Trial 1 time (s) 0.60 0.73 0.92 Trial 2 time (s) 0.59 0.71 0.90 Trial 3 time (s) 0.55 0.71 0.89 Trial 4 time (s) 0.56 0.70 0.88 Trial 5 time (s) 0.58 0.74 0.91 Average time (s) 0.576 0.718 0.9 Velocity (m/s) 0.262 0.351 0.389 Acceleration (m/s?) 0.458 0.493 0.432 Trendline acceleration X XGraph 1: Distance vs. Time Excel graph, should have Distance on y-axis, Time on x-axis, remember to include units Graph 2: Velocity vs. Time Excel graph, should have Velocity on y-axis, Time on x-axis, remember to include unitsData Table 3: Changing Distance on Flat Surface Release Point Distance 1 Distance 2 Distance 3 Distance (m) 0.1 0.15 0.25 0.35 Trial 1 time (s) 0.27 0.69 0.93 1.11 Trial 2 time (s) 0.28 0.69 0.93 1.10 Trial 3 time (s) 0.29 0.66 0.92 1.08 Trial 4 time (s) 0.32 0.67 0.95 1.13 Trial 5 time (s) 0.31 0.70 0.96 1.12 Average time (s) 0.294 0.682 0.938 1.106 Velocity (m/s) 0.340 0.22 0.267 0.315 Acceleration (m/s?) X 0.322 0.284 0.285 Trendline acceleration X X X (m/s2) Graph 3: Displacement vs. Time Excel graph, should have Displacement on y-axis, Time on x-axis, remember to include units Graph 4: Velocity vs. Time Excel graph, should have Velocity on y-axis, Time on x-axis, remember to include units
Step by Step Solution
There are 3 Steps involved in it

Get step-by-step solutions from verified subject matter experts