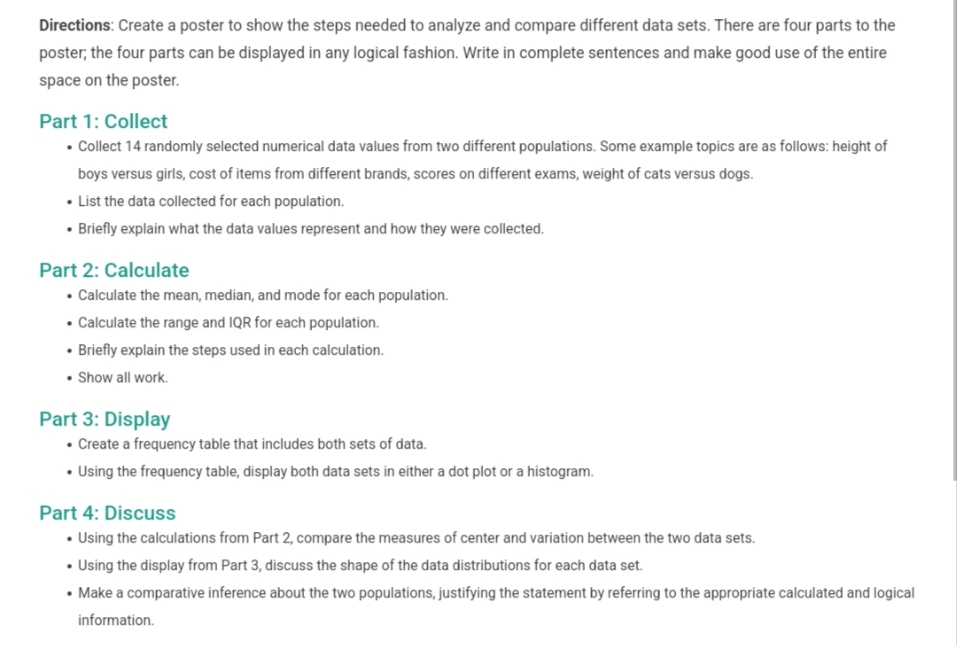
Question: please help me out with this and Directions: Create a poster to show the steps needed to analyze and compare different data sets. There are

please help me out with this and

please help me out with this and Directions:
Directions: Create a poster to show the steps needed to analyze and compare different data sets. There are four parts to the poster, the four parts can be displayed in any logical fashion. Write in complete sentences and make good use of the entire space on the poster. Part 1: Collect . Collect 14 randomly selected numerical data values from two different populations. Some example topics are as follows: height of boys versus girls, cost of items from different brands, scores on different exams, weight of cats versus dogs. . List the data collected for each population. . Briefly explain what the data values represent and how they were collected. Part 2: Calculate . Calculate the mean, median, and mode for each population. . Calculate the range and IQR for each population. . Briefly explain the steps used in each calculation. . Show all work. Part 3: Display . Create a frequency table that includes both sets of data. . Using the frequency table, display both data sets in either a dot plot or a histogram. Part 4: Discuss . Using the calculations from Part 2, compare the measures of center and variation between the two data sets. . Using the display from Part 3, discuss the shape of the data distributions for each data set. . Make a comparative inference about the two populations, justifying the statement by referring to the appropriate calculated and logical information

Step by Step Solution

There are 3 Steps involved in it

1 Expert Approved Answer
Step: 1 Unlock blur-text-image
Question Has Been Solved by an Expert!

Get step-by-step solutions from verified subject matter experts

Step: 2 Unlock
Step: 3 Unlock

Students Have Also Explored These Related Mathematics Questions!