

Question: Please help me out with this question. I need a detailed explanation. Toronto General Hospital is trying to improve the patient experience by improving food
Please help me out with this question. I need a detailed explanation.
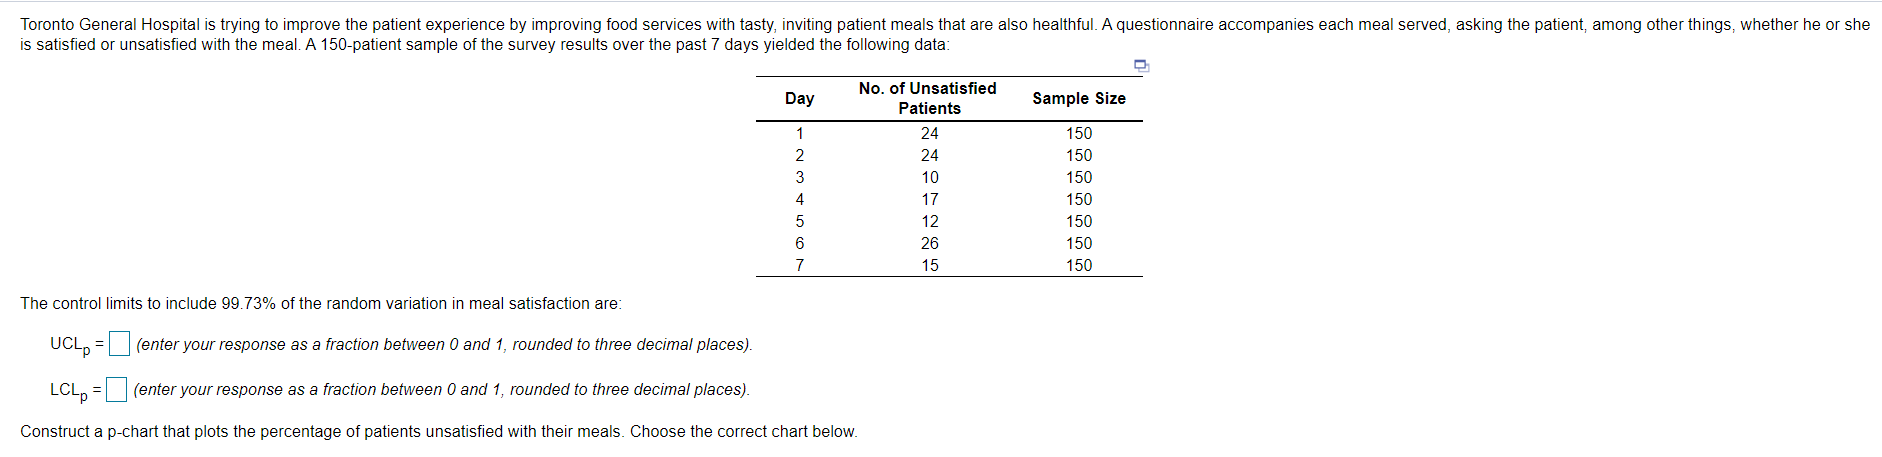
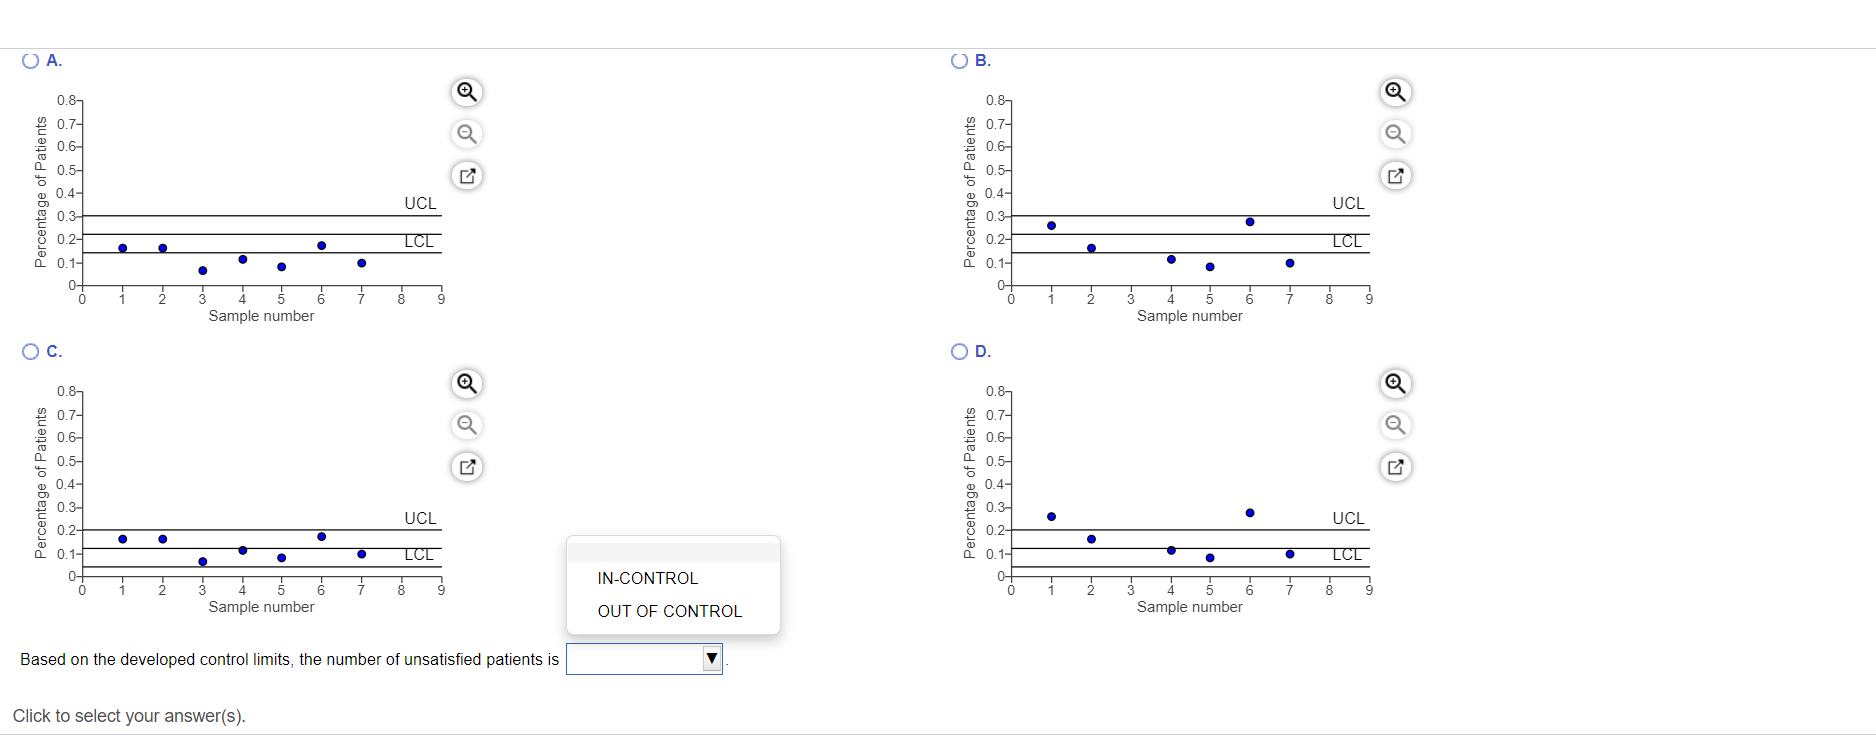
Toronto General Hospital is trying to improve the patient experience by improving food services with tasty, inviting patient meals that are also healthful. A questionnaire accompanies each meal served, asking the patient, among other things, whether he or she is satisfied or unsatisfied with the meal. A 150-patient sample of the survey results over the past 7 days yielded the following data Day Sample Size 1 2 3 4 No. of Unsatisfied Patients 24 24 10 17 12 26 15 150 150 150 150 150 150 150 5 6 7 The control limits to include 99.73% of the random variation in meal satisfaction are: UCLA =(enter your response as a fraction between 0 and 1, rounded to three decimal places). LCLp = (enter your response as a fraction between 0 and 1, rounded to three decimal places). Construct a p-chart that plots the percentage of patients unsatisfied with their meals. Choose the correct chart below. OA. OB. 0.8 0.8 0.7- 0.6- o I Percentage of Patients 0.72 0.6- 0.5- 0.4- Percentage of Patients UCL UCL 0.5- 0.4- 0.3- 0.2 0.1- 0- 0 0.34 LCL 0.2- LCL 0 0.1- . 11 2 7 4 5 6 Sample number 8 0- 0 1 2 7 8 3 5 6 Sample number OC. D. 0.7- 0.6 Percentage of Patients 0.8- 0.7- 0.6- 0.5- 0.4- 0.34 0.2 0.1- Percentage of Patients 0.5 0.4- 0.3- 0.2- UCL UCL 0 LCL 0.1- LCL 0- 2 0- IN-CONTROL 7 8 g 3 Sample number 5 6 Sample number OUT OF CONTROL Based on the developed control limits, the number of unsatisfied patients is Click to select your answer(s)Step by Step Solution
There are 3 Steps involved in it
1 Expert Approved Answer
Step: 1 Unlock

Question Has Been Solved by an Expert!
Get step-by-step solutions from verified subject matter experts
Step: 2 Unlock
Step: 3 Unlock