

Question: Please help me quick answers Hand written please Exercice 2. The following table shows the number of defective and acceptable items in samples taken both
Please help me quick answers Hand written please
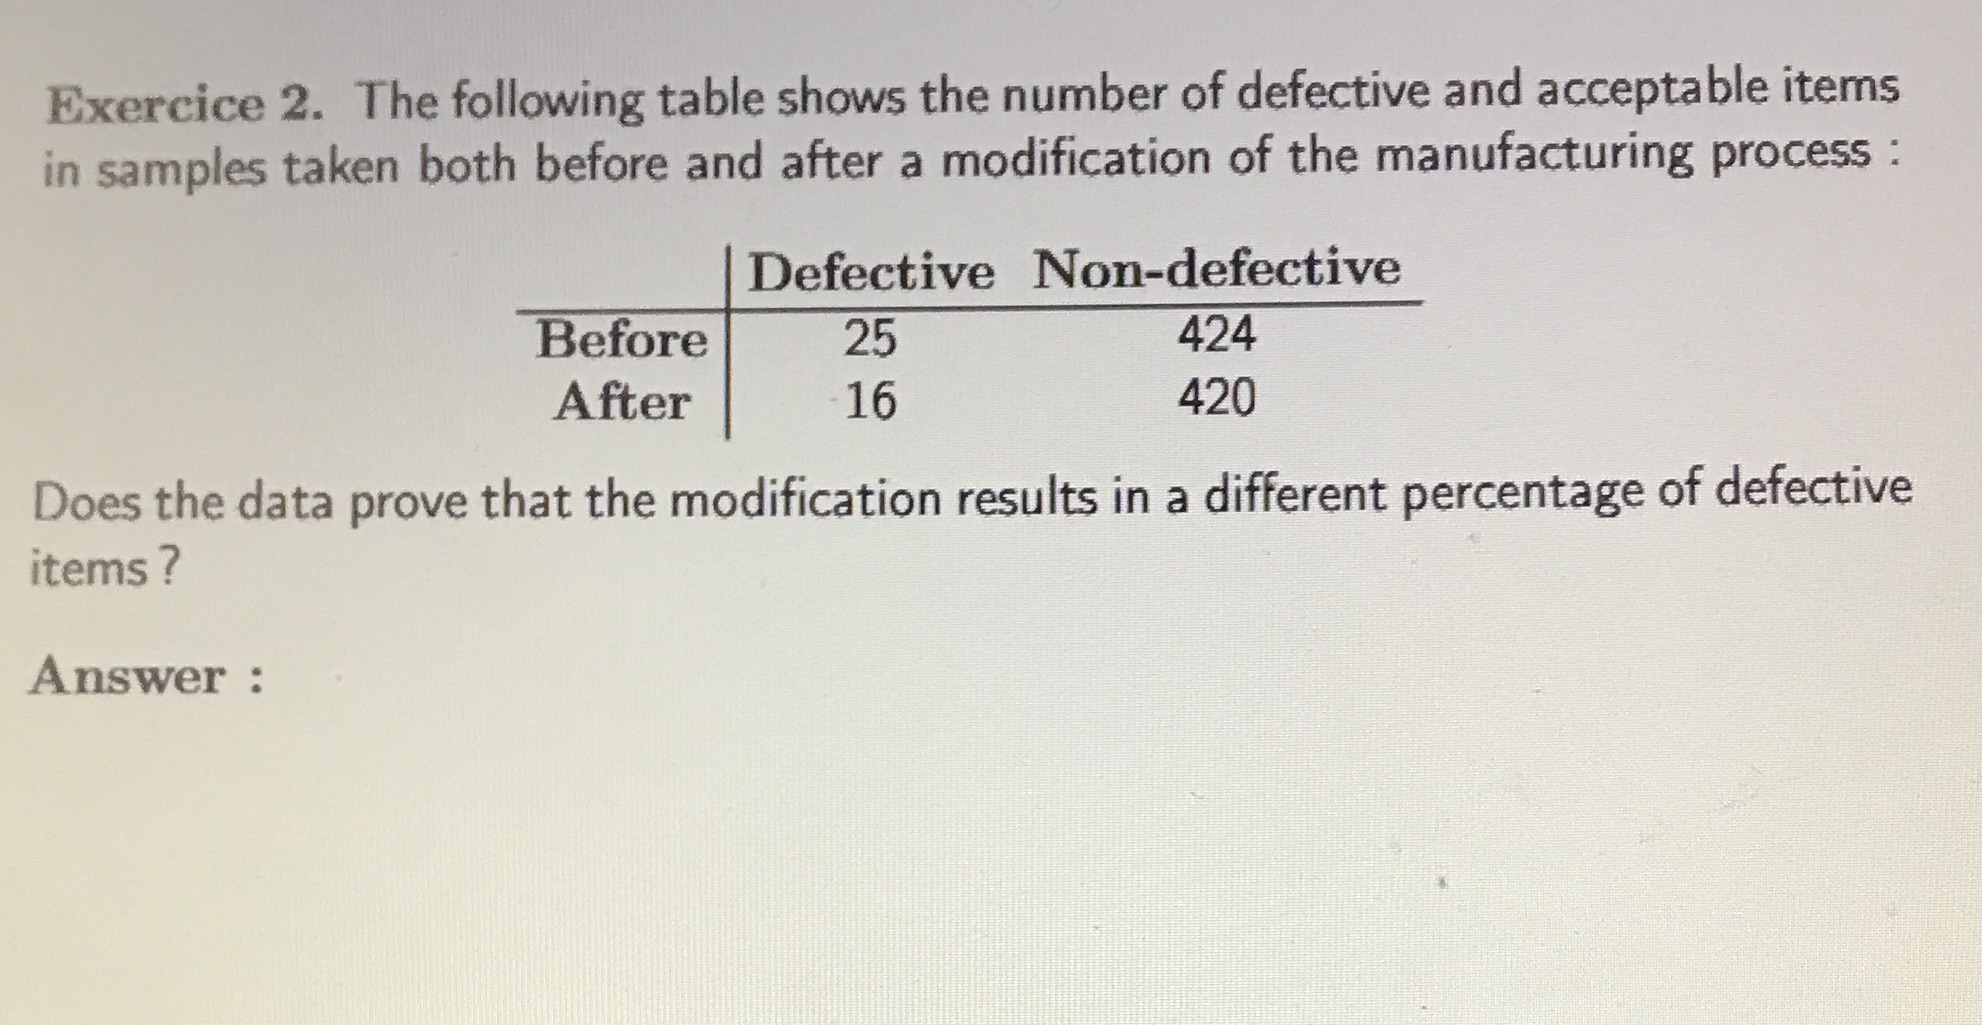
Exercice 2. The following table shows the number of defective and acceptable items in samples taken both before and after a modification of the manufacturing process : Defective Non-defective Before 25 424 After 16 420 Does the data prove that the modification results in a different percentage of defective items
Step by Step Solution
There are 3 Steps involved in it
1 Expert Approved Answer
Step: 1 Unlock

Question Has Been Solved by an Expert!
Get step-by-step solutions from verified subject matter experts
Step: 2 Unlock
Step: 3 Unlock