

Question: Please solve Exercice 2. The following table shows the number of defective and acceptable items in samples taken both before and after a modification of
Please solve
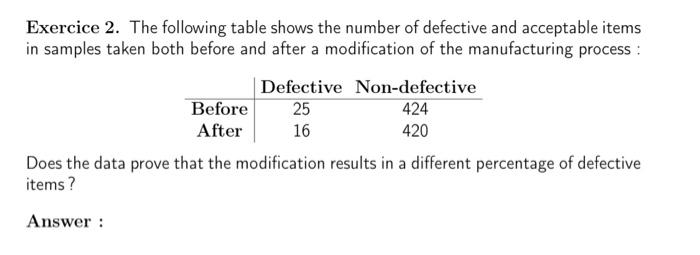
Exercice 2. The following table shows the number of defective and acceptable items in samples taken both before and after a modification of the manufacturing process ; Defective Non-defective Before 25 424 After 15 420 Does the data prove that the modification results in a different percentage of defective items
Step by Step Solution
There are 3 Steps involved in it
1 Expert Approved Answer
Step: 1 Unlock

Question Has Been Solved by an Expert!
Get step-by-step solutions from verified subject matter experts
Step: 2 Unlock
Step: 3 Unlock