

Question: Please help me resolve this as previous steps did not fully work for a full solution. Thank you in advance. 2. Demand elasticity and the
Please help me resolve this as previous steps did not fully work for a full solution. Thank you in advance.
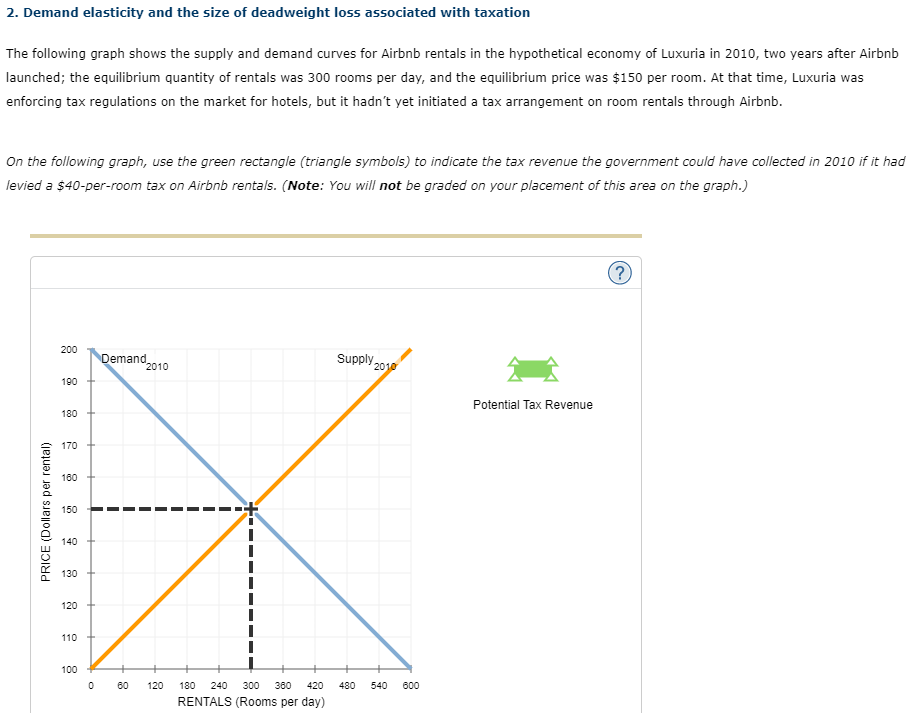
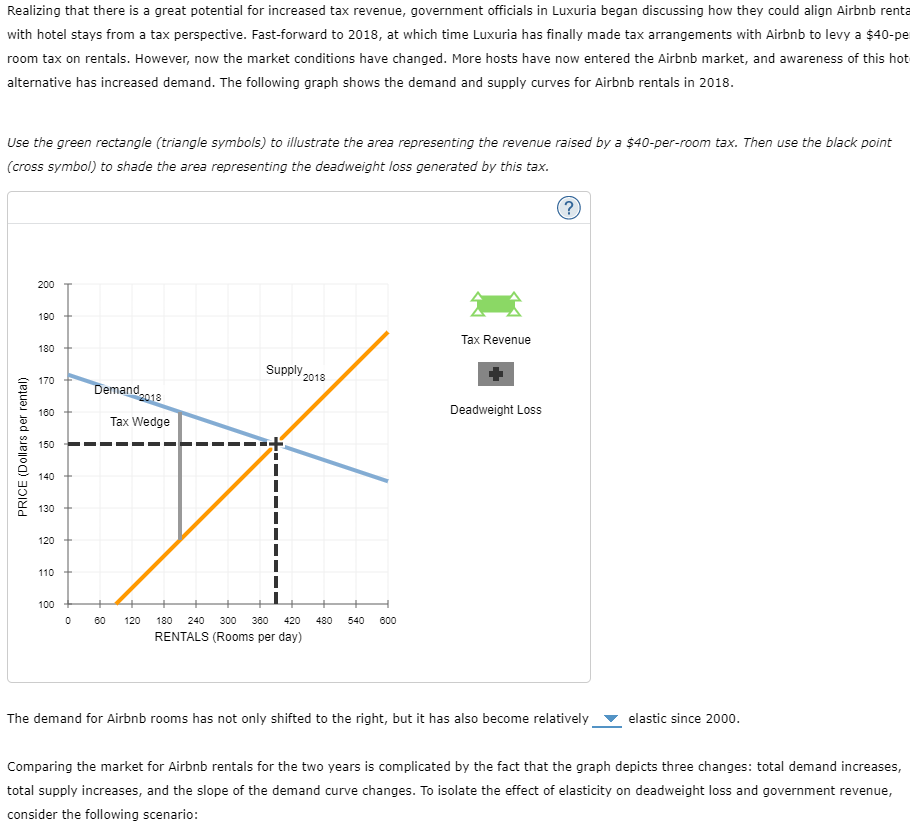
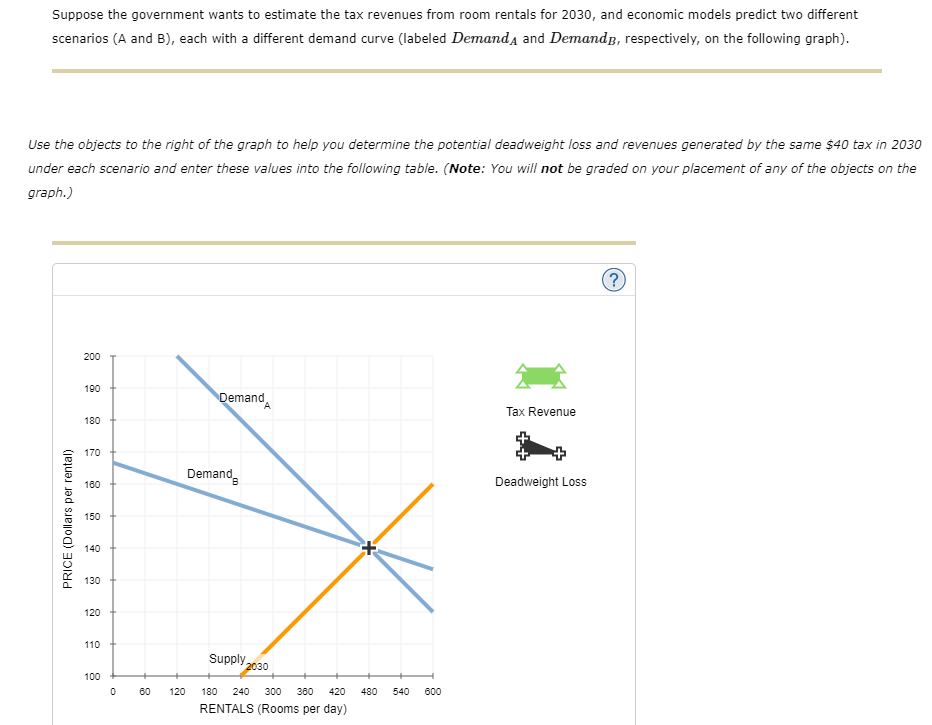
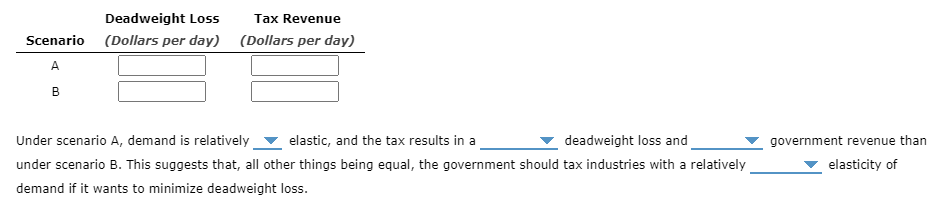
2. Demand elasticity and the size of deadweight loss associated with taxation The following graph shows the supply and demand curves for Airbnb rentals in the hypothetical economy of Luxuria in 2010, two years after Airbnb launched; the equilibrium quantity of rentals was 300 rooms per day, and the equilibrium price was $150 per room. At that time, Luxuria was enforcing tax regulations on the market for hotels, but it hadn't yet initiated a tax arrangement on room rentals through Airbnb. On the following graph, use the green rectangle (triangle symbols) to indicate the tax revenue the government could have collected in 2010 if it had levied a $40-per-room tax on Airbnb rentals. (Note: You will not be graded on your placement of this area on the graph.) 200 `Demand2010 Supply 2010 190 Potential Tax Revenue 180 170 180 PRICE (Dollars per rental) 150 140 130 120 110 100 0 60 120 180 240 300 360 420 480 540 600 RENTALS (Rooms per day)Realizing that there is a great potential for increased tax revenue, government officials in Luxuria began discussing how they could align Airbnb rent with hotel stays from a tax perspective. Fast-forward to 2018, at which time Luxuria has finally made tax arrangements with Airbnb to levy a $40-pe room tax on rentals. However, now the market conditions have changed. More hosts have now entered the Airbnb market, and awareness of this hot alternative has increased demand. The following graph shows the demand and supply curves for Airbnb rentals in 2018. Use the green rectangle (triangle symbols) to illustrate the area representing the revenue raised by a $40-per-room tax. Then use the black point (cross symbol) to shade the area representing the deadweight loss generated by this tax. 200 190 Tax Revenue 180 Supply 2018 170 Demand2018 180 Deadweight Loss Tax Wedge PRICE (Dollars per rental) 150 140 130 120 110 100 0 60 120 180 240 300 360 420 480 540 600 RENTALS (Rooms per day) The demand for Airbnb rooms has not only shifted to the right, but it has also become relatively _ elastic since 2000. Comparing the market for Airbnb rentals for the two years is complicated by the fact that the graph depicts three changes: total demand increases, total supply increases, and the slope of the demand curve changes. To isolate the effect of elasticity on deadweight loss and government revenue, consider the following scenario:Suppose the government wants to estimate the tax revenues from room rentals for 2030, and economic models predict two different scenarios (A and B), each with a different demand curve (labeled DemandA and Demands, respectively, on the following graph). Use the objects to the right of the graph to help you determine the potential deadweight loss and revenues generated by the same $40 tax in 2030 under each scenario and enter these values into the following table. (Note: You will not be graded on your placement of any of the objects on the graph.) (? ) 200 190 Demand Tax Revenue 180 170 Demand Deadweight Loss 180 150 PRICE (Dollars per rental) 140 130 120 110 Supply 2030 100 0 60 120 180 240 300 360 420 480 540 600 RENTALS (Rooms per day)Deadweig ht Loss Tax Revenue Scenario (Dollars per day) (Dollars per day) A:: 3:: Under scenario A, demand is relatively v elastic, and the tax results in a v deadweight loss and v government revenue than under scenario B. This suggests that! all other things being equal, the government should tax industries with a relatively v elasticity of demand if it wants to minimize deadweight loss
Step by Step Solution
There are 3 Steps involved in it

Get step-by-step solutions from verified subject matter experts