

Question: Please help me run this code. When I run this in Rstudio, during filtering the whole data gets 0. There is no indic_pr in data
Please help me run this code. When I run this in Rstudio, during filtering the whole data gets 0. There is no indic_pr in data that is defined in filtering as well. I need to make the following visualization This code is not working. Please provide solution for the question below.
install.packages("eurostat") install.packages("ggplot2") install.packages("dplyr") library(eurostat) library(ggplot2) library(dplyr) # Get data hicp_data
# Add country names country_names
hicp_data$geo
# Filter data hicp_data
hicp_data
# Visualization ggplot(hicp_data, aes(x = geo, y = values, fill = time)) + geom_col(position = position_dodge(), color = "black", size = 0.5) + scale_fill_manual(values = c("#FFC500", "#FF7E00")) + xlab("Country") + ylab("HICP") + ggtitle("Harmonized Index of Consumer Prices") + theme_minimal()
# Clustering hicp_data % group_by(geo) %>% summarise(change = values[2] - values[1])
clusters
# Visualize the clusters ggplot(hicp_data, aes(x = geo, y = change, fill = cluster)) + geom_col(color = "black", size = 0.5) + scale_fill_manual(values = c("#FFC500", "#FF7E00", "#D50000")) + xlab("Country") + ylab("Change in HICP") + ggtitle("Change in Harmonized Index of Consumer Prices") + theme_minimal()
This project is about the harmonized index of consumer prices in the EU. It involves three simple steps. First, you must get the data, then its simple visualization, and finally, its clustering.
Data
The data come from Eurostat. The easiest way to get the data is to use the eurostat package. We deal with the monthly HICP year-on-year data for the whole basket (CP00) for all EU countries from Feb 2000 through Sep 2022. The datasets code is prc_hicp_manr. In the dataset, there are only countries codes, e.g., `PL` for Poland or DE for Germany. You have to add proper country names. Simple visualization. Once the data frame is ready (previous step), we need to create a simple visualization. The following figure shows a simple example. I used the ggplot2 package, but it is up to you how to make the figure. You do not have to match my figure exactly. Yet, you have to retain the same features.
Clustering
An HICP time series represent each country. All time series are of equal length. We can treat these time series as vectors of equal dimension. We want to see how similar countries are in terms of HICP. Thus, we use the clustering analysis. In particular, you have to use agglomerative hierarchical clustering with complete linkage. Differences between the vectors (times series) should be computed with the Minkowski metrics for p=1.5=1.5. Finally, based on the resulting tree, create 44 clusters. Once this is done, create a simple visualization. The following figure shows an example of the visualization.
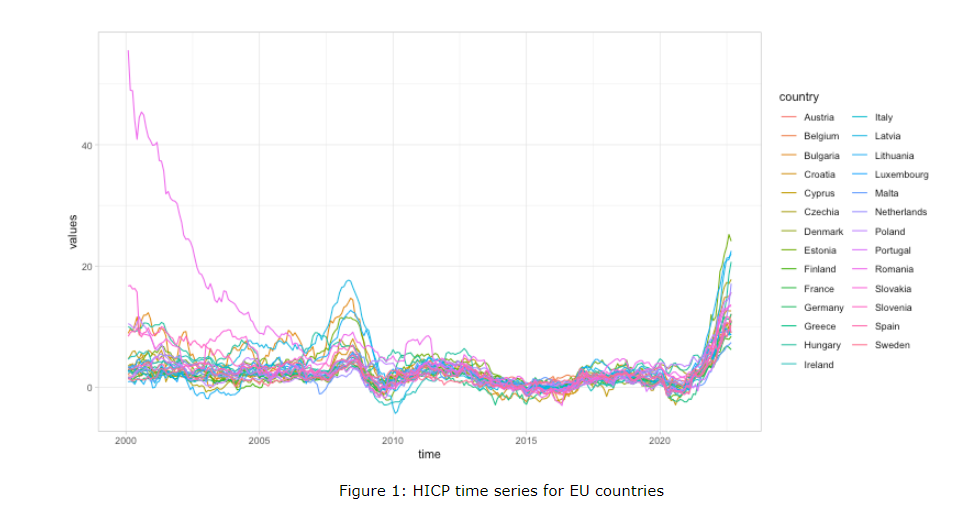
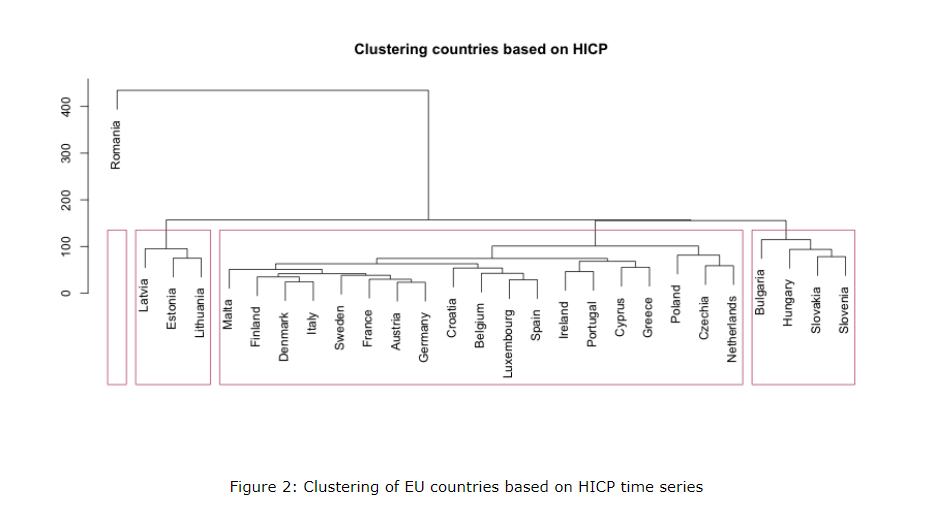
Figure 1: HICP time series for EU countries Figure 2: Clustering of EU countries based on HICP time series
Step by Step Solution
There are 3 Steps involved in it

Get step-by-step solutions from verified subject matter experts