

Question: Please help me solve 1. The data from a study of orange juice produced at a juice manufacturing plant are in the tal was used
Please help me solve
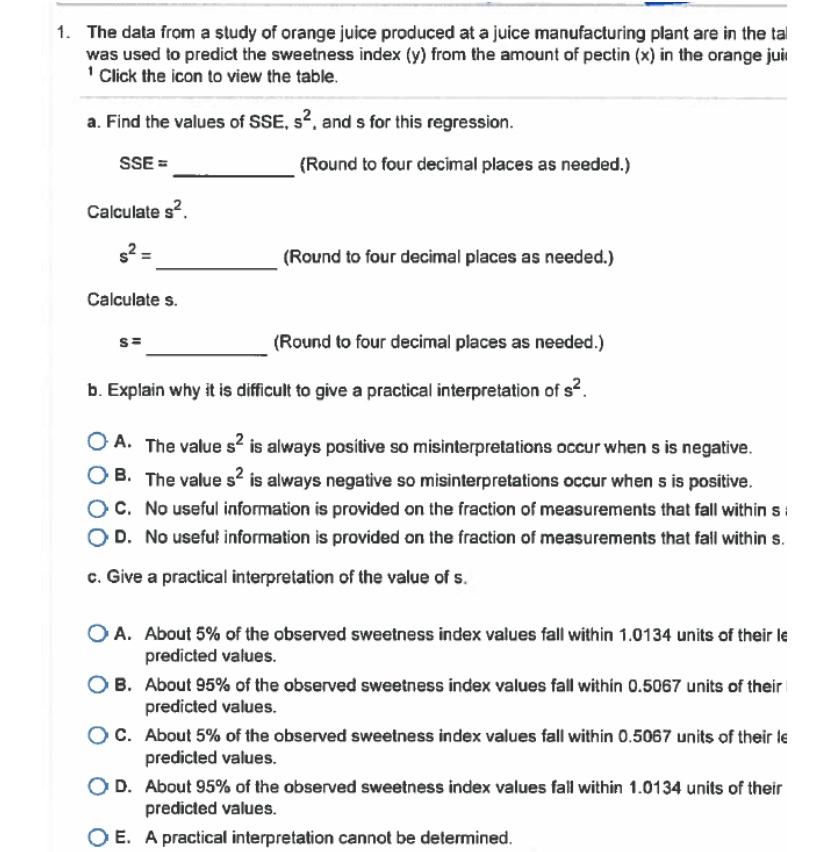

1. The data from a study of orange juice produced at a juice manufacturing plant are in the tal was used to predict the sweetness index (y) from the amount of pectin (x) in the orange jui 1 Click the icon to view the table. a. Find the values of SSE, s , and s for this regression. SSE = (Round to four decimal places as needed.) Calculate s2. $2 = (Round to four decimal places as needed.) Calculate s. S= (Round to four decimal places as needed.) b. Explain why it is difficult to give a practical interpretation of s2. O A. The value s2 is always positive so misinterpretations occur when s is negative. O B. The value s2 is always negative so misinterpretations occur when s is positive. O C. No useful information is provided on the fraction of measurements that fall within s O D. No useful information is provided on the fraction of measurements that fall within s. c. Give a practical interpretation of the value of s. O A. About 5% of the observed sweetness index values fall within 1.0134 units of their le predicted values. O B. About 95% of the observed sweetness index values fall within 0.5067 units of their predicted values. O C. About 5% of the observed sweetness index values fall within 0.5067 units of their le predicted values. OD. About 95% of the observed sweetness index values fall within 1.0134 units of their predicted values. O E. A practical interpretation cannot be determined
Step by Step Solution
There are 3 Steps involved in it

Get step-by-step solutions from verified subject matter experts