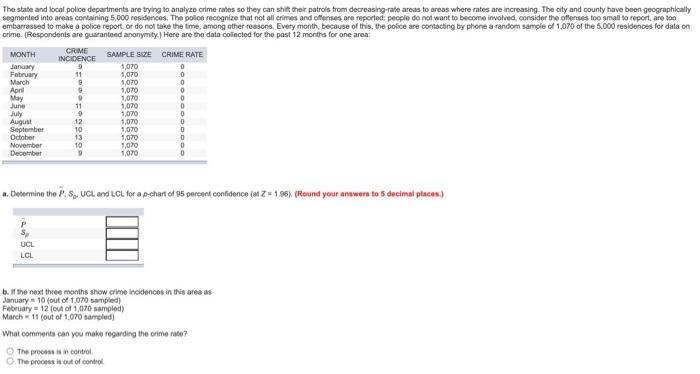
Question: Please help me solve, thank you (: I will thumbs up if correct January The state and local police departments are trying to analyze crime

Please help me solve, thank you (:
I will thumbs up if correct
Please help me solve, thank you (: I will thumbs
January The state and local police departments are trying to analyze crime rates so they can shit their patrols from decreasing-rate areas to areas where rates are increasing. The city and county have been geographically segmented into areas containing 5,000 residences. The police recognize that not all crimes and offenses are reported people do not want to become involved, consider the offenses too small to report, are too embarrassed to make a police report or do not take the tine, among other reasons. Every month, because of this, the police are contacting by phone a random sample of 1,070 of the 5.000 residences for data on crime. (Respondents are guaranteed anonymity) Here are the data collected for the past 12 months for one area MONTH CRIME INCIDENCE SAMPLE SIZE CRIME RATE . 1,070 February . 11 1,070 0 March 1,070 April . 1,070 0 1,070 0 June 11 1,070 0 July 1,070 0 12 0 10 0 13 a November 10 0 December 9 1,070 0 September Odober 1070 1.070 1,070 1.00 Determine the P.S.UCL and LCL for a p-chart of 95 percent confidence (st Z=1.96). (Round your answers to decimal places) UCL LCL b. If the next three months show crime incidences in this area as January 10 out of 1,070 sampled) February 12 (out of 1,070 sampled) March 11 out of 1.070 sampled) What comments can you make regarding the crime rate? > The process is in control The process is out of control

Step by Step Solution

There are 3 Steps involved in it

1 Expert Approved Answer
Step: 1 Unlock blur-text-image
Question Has Been Solved by an Expert!

Get step-by-step solutions from verified subject matter experts

Step: 2 Unlock
Step: 3 Unlock

Students Have Also Explored These Related General Management Questions!