

Question: please help me solve these queations Please answer the following questions. 1. Which company exhibited a more favorable sales returns percentage in 2021, Retail A
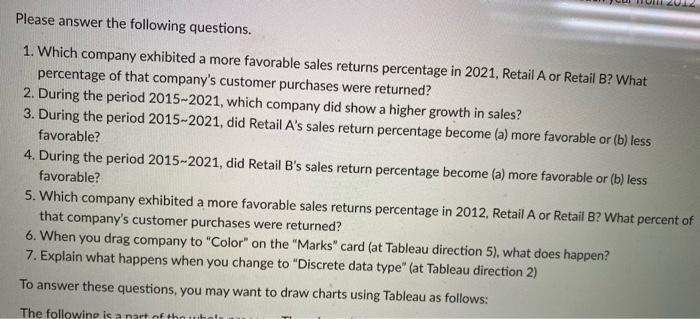
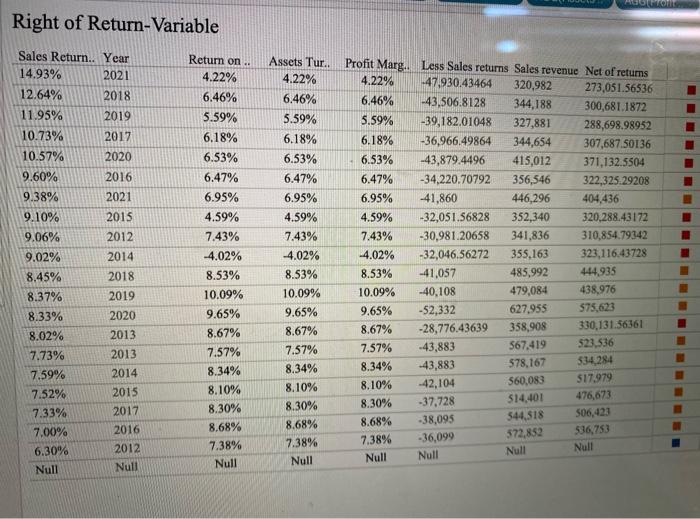
Please answer the following questions. 1. Which company exhibited a more favorable sales returns percentage in 2021, Retail A or Retail B? What percentage of that company's customer purchases were returned? 2. During the period 2015-2021, which company did show a higher growth in sales? 3. During the period 2015-2021, did Retail A's sales return percentage become (a) more favorable or (b) less favorable? 4. During the period 2015-2021, did Retail B's sales return percentage become (a) more favorable or (b) less favorable? 5. Which company exhibited a more favorable sales returns percentage in 2012, Retail A or Retail B? What percent of that company's customer purchases were returned? 6. When you drag company to "Color" on the "Marks" card (at Tableau direction 5), what does happen? 7. Explain what happens when you change to "Discrete data type" (at Tableau direction 2) To answer these questions, you may want to draw charts using Tableau as follows: The following is a nart of thn Right of Return-Variable Sales Return.. Year 14,93% 2021 12.64% 2018 11.95% 2019 10.73% 2017 10.57% 2020 9.60% 2016 9.38% 2021 9.10% 2015 9.06% 2012 9.02% 2014 8.45% 2018 8.37% 2019 8.33% 2020 8.02% 2013 7.73% 2013 7.59% 2014 7.52% 2015 7.33% 2017 7.00% 2016 6.30% 2012 Null Null Retum on.. 4.22% 6.46% 5.59% 6.18% 6.53% 6.47% 6.95% 4.59% 7.43% -4.02% 8.53% 10.09% 9.65% 8.67% 7.57% 8.34% 8.10% 8.30% 8.68% 7.38% Null Assets Tur. 4.22% 6.46% 5.59% 6.18% 6.53% 6.47% 6.95% 4.59% 7.43% 4.02% 8.53% 10.09% 9.65% 8.67% 7.57% 8.34% 8.10% 8,30% 8.68% 7.38% Null Profit Marg.. Less Sales returns Sales revenue Net of retums 4.22% -47,930.43464 320,982 273,051.56536 6.46% -43.506.8128 344,188 300,681.1872 5.59% -39,182.01048 327,881 288,698.98952 6.18% -36,966.49864 344,654 307,687.50136 6.53% -43,879.4496 415,012 371,132.5504 6.47% -34,220.70792 356,546 322,325.29208 6.95% -41,860 446,296 404,436 4.59% -32,051.56828 352,340 320,288.43172 7.43% -30,981.20658 341,836 310,854.79342 4.02% -32,046.56272 355,163 323,116,43728 8.53% -41,057 485,992 444.935 10.09% -40,108 479,084 438,976 9.65% -52,332 627,955 575,623 8.67% -28,776.43639 358,908 330,131,56361 7.57% -43,883 567,419 523,536 8.34% -43,883 578,167 334,284 8.10% -42,104 560,083 $17.979 476,673 8.30% 514,401 -37,728 506,423 8.68% 544,518 -38,095 536,753 7.38% 572,852 -36,099 Null Null Null Null ssets AGG(Profil Right of Return-Variable Sales Return.. Year 14.93% 2021 12.64% 11.95% . . . . . 10.73% 10.57% 9.60% 9.38% 9.10% 9.06% 9.02% 8.45% 8.37% 8.33% 8.02% 7.73% 7.59% 7.52% 7.33% 7.00% 6.30% Null Return on .. 4.22% 6.46% 5.59% 6.18% 6.53% 6.47% 6.95% 4.59% 7.43% -4.02% 8.53% 10.09% 9.65% 8.67% 7.57% 8.34% 8.10% 8.30% 8.68% 7.38% Null 2018 2019 2017 2020 2016 2021 2015 2012 2014 2018 2019 2020 2013 2013 2014 2015 2017 2016 2012 Null . Assets Tur.. Profit Marg.. Less Sales returns Sales revenue Net of returns 4.22% 4.22% -47,930.43464 320,982 273,051,56536 6,46% 6.46% -43,506,8128 344,188 300,681.1872 5.59% 5.59% -39,182.01048 327,881 288,698.98952 6.18% 6.18% -36,966.49864 344,654 307,687.50136 6.53% 6.53% -43,879.4496 415,012 371,132 5504 6.47% 6.47% -34,220.70792 356,546 322,325.29208 6.95% 6.95% -41,860 446,296 404,436 4.59% 4.59% -32,051.56828 352,340 320.288.43172 7.43% 7.43% -30,981 20658 341,836 310,854.79342 -4.02% -4.02% -32,046.56272 355,163 323,1 16.43728 8.53% 8.53% -41,057 485,992 444,935 10.09% 10.09% -40,108 479,084 438,976 9.65% 9.65% -$2,332 627,955 575,633 8.67% 8.67% -28,776,43639 358,908 330, 131.56361 7.57% 7.57% 43,883 567.419 $23.536 8.34% 8.34% -43,883 578,167 534,254 8.10% 8.10% 42,104 560,083 517979 8.30% $14,401 -37,728 8.30% 476,673 $06.23 $44,518 8.68% 8.68% -38,095 $36,750 572,852 7.3896 7.38% -36,099 Null Null Null Null Nul Please answer the following questions. 1. Which company exhibited a more favorable sales returns percentage in 2021, Retail A or Retail B? What percentage of that company's customer purchases were returned? 2. During the period 2015-2021, which company did show a higher growth in sales? 3. During the period 2015-2021, did Retail A's sales return percentage become (a) more favorable or (b) less favorable? 4. During the period 2015-2021, did Retail B's sales return percentage become (a) more favorable or (b) less favorable? 5. Which company exhibited a more favorable sales returns percentage in 2012, Retail A or Retail B? What percent of that company's customer purchases were returned? 6. When you drag company to "Color" on the "Marks" card (at Tableau direction 5), what does happen? 7. Explain what happens when you change to "Discrete data type" (at Tableau direction 2) To answer these questions, you may want to draw charts using Tableau as follows: The following is a nart of thn Right of Return-Variable Sales Return.. Year 14,93% 2021 12.64% 2018 11.95% 2019 10.73% 2017 10.57% 2020 9.60% 2016 9.38% 2021 9.10% 2015 9.06% 2012 9.02% 2014 8.45% 2018 8.37% 2019 8.33% 2020 8.02% 2013 7.73% 2013 7.59% 2014 7.52% 2015 7.33% 2017 7.00% 2016 6.30% 2012 Null Null Retum on.. 4.22% 6.46% 5.59% 6.18% 6.53% 6.47% 6.95% 4.59% 7.43% -4.02% 8.53% 10.09% 9.65% 8.67% 7.57% 8.34% 8.10% 8.30% 8.68% 7.38% Null Assets Tur. 4.22% 6.46% 5.59% 6.18% 6.53% 6.47% 6.95% 4.59% 7.43% 4.02% 8.53% 10.09% 9.65% 8.67% 7.57% 8.34% 8.10% 8,30% 8.68% 7.38% Null Profit Marg.. Less Sales returns Sales revenue Net of retums 4.22% -47,930.43464 320,982 273,051.56536 6.46% -43.506.8128 344,188 300,681.1872 5.59% -39,182.01048 327,881 288,698.98952 6.18% -36,966.49864 344,654 307,687.50136 6.53% -43,879.4496 415,012 371,132.5504 6.47% -34,220.70792 356,546 322,325.29208 6.95% -41,860 446,296 404,436 4.59% -32,051.56828 352,340 320,288.43172 7.43% -30,981.20658 341,836 310,854.79342 4.02% -32,046.56272 355,163 323,116,43728 8.53% -41,057 485,992 444.935 10.09% -40,108 479,084 438,976 9.65% -52,332 627,955 575,623 8.67% -28,776.43639 358,908 330,131,56361 7.57% -43,883 567,419 523,536 8.34% -43,883 578,167 334,284 8.10% -42,104 560,083 $17.979 476,673 8.30% 514,401 -37,728 506,423 8.68% 544,518 -38,095 536,753 7.38% 572,852 -36,099 Null Null Null Null ssets AGG(Profil Right of Return-Variable Sales Return.. Year 14.93% 2021 12.64% 11.95% . . . . . 10.73% 10.57% 9.60% 9.38% 9.10% 9.06% 9.02% 8.45% 8.37% 8.33% 8.02% 7.73% 7.59% 7.52% 7.33% 7.00% 6.30% Null Return on .. 4.22% 6.46% 5.59% 6.18% 6.53% 6.47% 6.95% 4.59% 7.43% -4.02% 8.53% 10.09% 9.65% 8.67% 7.57% 8.34% 8.10% 8.30% 8.68% 7.38% Null 2018 2019 2017 2020 2016 2021 2015 2012 2014 2018 2019 2020 2013 2013 2014 2015 2017 2016 2012 Null . Assets Tur.. Profit Marg.. Less Sales returns Sales revenue Net of returns 4.22% 4.22% -47,930.43464 320,982 273,051,56536 6,46% 6.46% -43,506,8128 344,188 300,681.1872 5.59% 5.59% -39,182.01048 327,881 288,698.98952 6.18% 6.18% -36,966.49864 344,654 307,687.50136 6.53% 6.53% -43,879.4496 415,012 371,132 5504 6.47% 6.47% -34,220.70792 356,546 322,325.29208 6.95% 6.95% -41,860 446,296 404,436 4.59% 4.59% -32,051.56828 352,340 320.288.43172 7.43% 7.43% -30,981 20658 341,836 310,854.79342 -4.02% -4.02% -32,046.56272 355,163 323,1 16.43728 8.53% 8.53% -41,057 485,992 444,935 10.09% 10.09% -40,108 479,084 438,976 9.65% 9.65% -$2,332 627,955 575,633 8.67% 8.67% -28,776,43639 358,908 330, 131.56361 7.57% 7.57% 43,883 567.419 $23.536 8.34% 8.34% -43,883 578,167 534,254 8.10% 8.10% 42,104 560,083 517979 8.30% $14,401 -37,728 8.30% 476,673 $06.23 $44,518 8.68% 8.68% -38,095 $36,750 572,852 7.3896 7.38% -36,099 Null Null Null Null Nul
Step by Step Solution
There are 3 Steps involved in it

Get step-by-step solutions from verified subject matter experts