

Question: Please help me solve these questions that will help me for my up coming test (no cursive) 1. Find an example of data that has
Please help me solve these questions that will help me for my up coming test (no cursive)
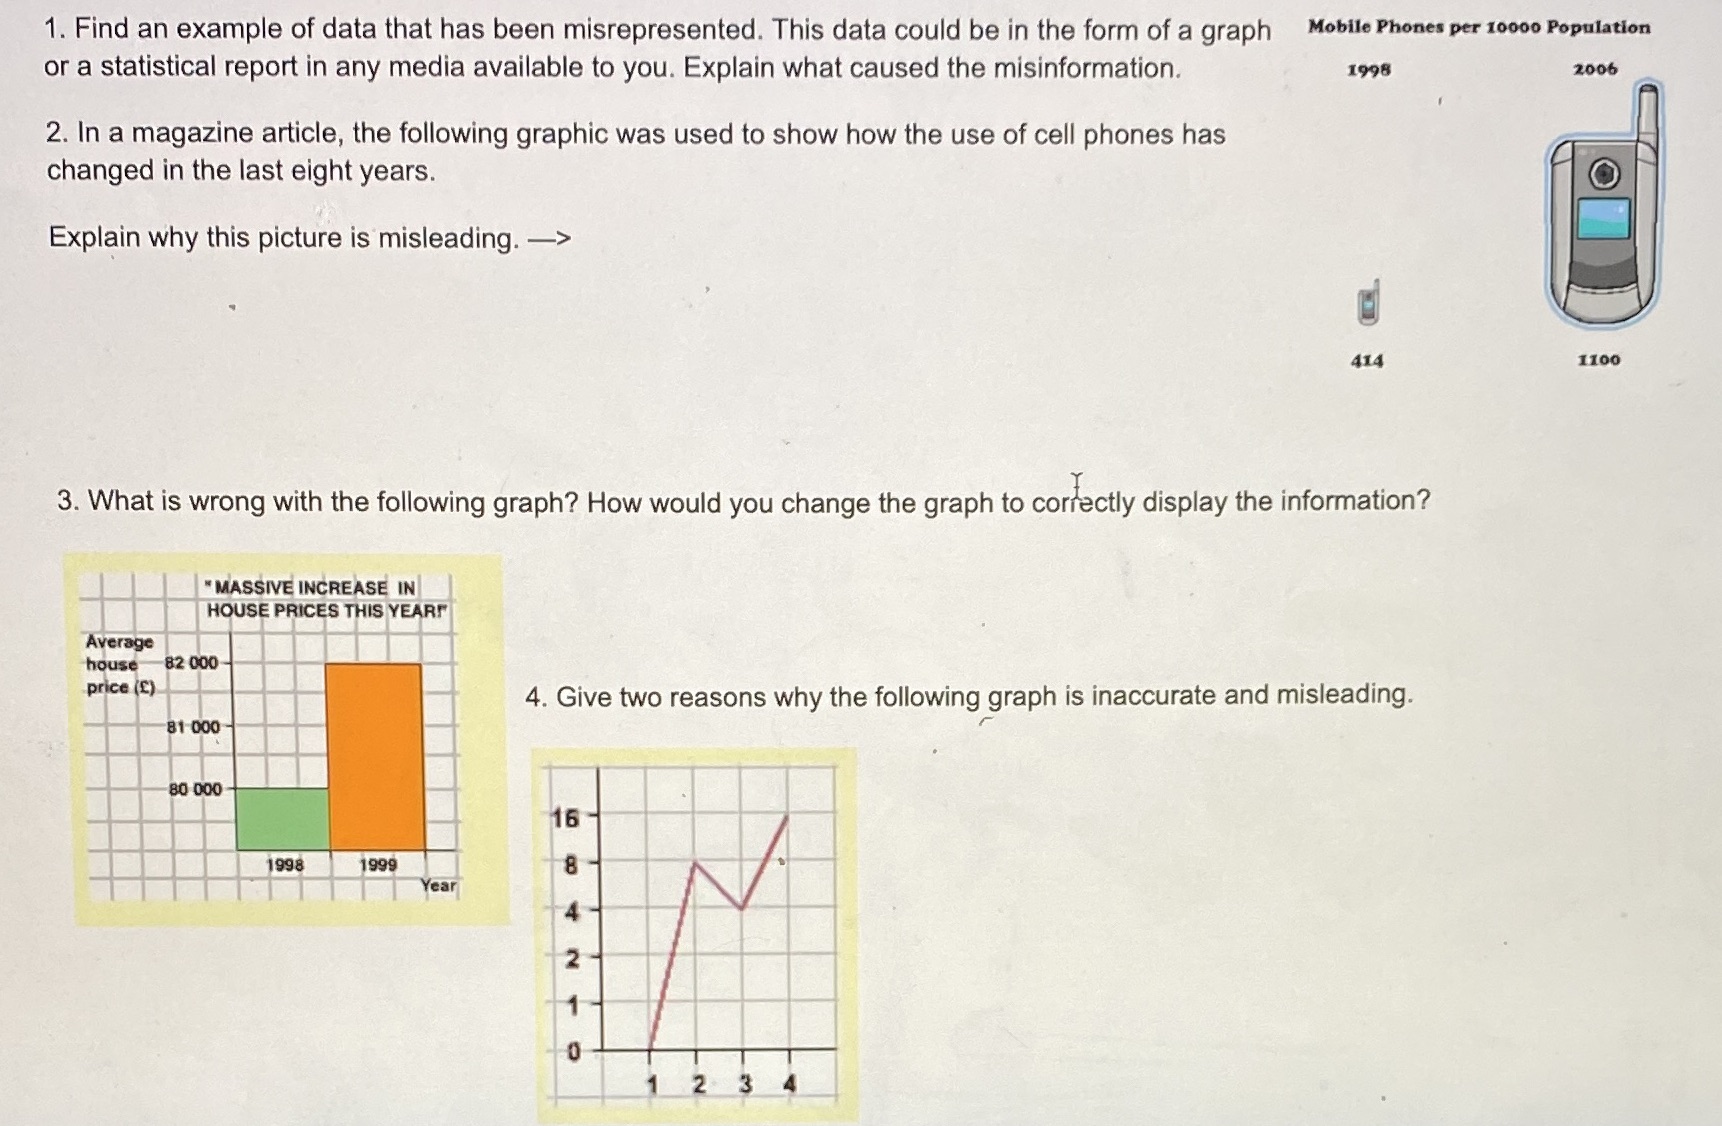
1. Find an example of data that has been misrepresented. This data could be in the form of a graph Mobile Phones per 10000 Population or a statistical report in any media available to you. Explain what caused the misinformation. 1998 2006 2. In a magazine article, the following graphic was used to show how the use of cell phones has changed in the last eight years. Explain why this picture is misleading. 414 1100 3. What is wrong with the following graph? How would you change the graph to correctly display the information? "MASSIVE INCREASE IN HOUSE PRICES THIS YEARF Average house 82 000 price (C) 4. Give two reasons why the following graph is inaccurate and misleading. 81 000 80 000 16 1998 1999 8 Year 2 2 3
Step by Step Solution
There are 3 Steps involved in it

Get step-by-step solutions from verified subject matter experts