

Question: Please help me solve this and understand how to solve it. Thank you CS This Question: 1 pt 20 of 26 (11 complete) This Test:
Please help me solve this and understand how to solve it. Thank you
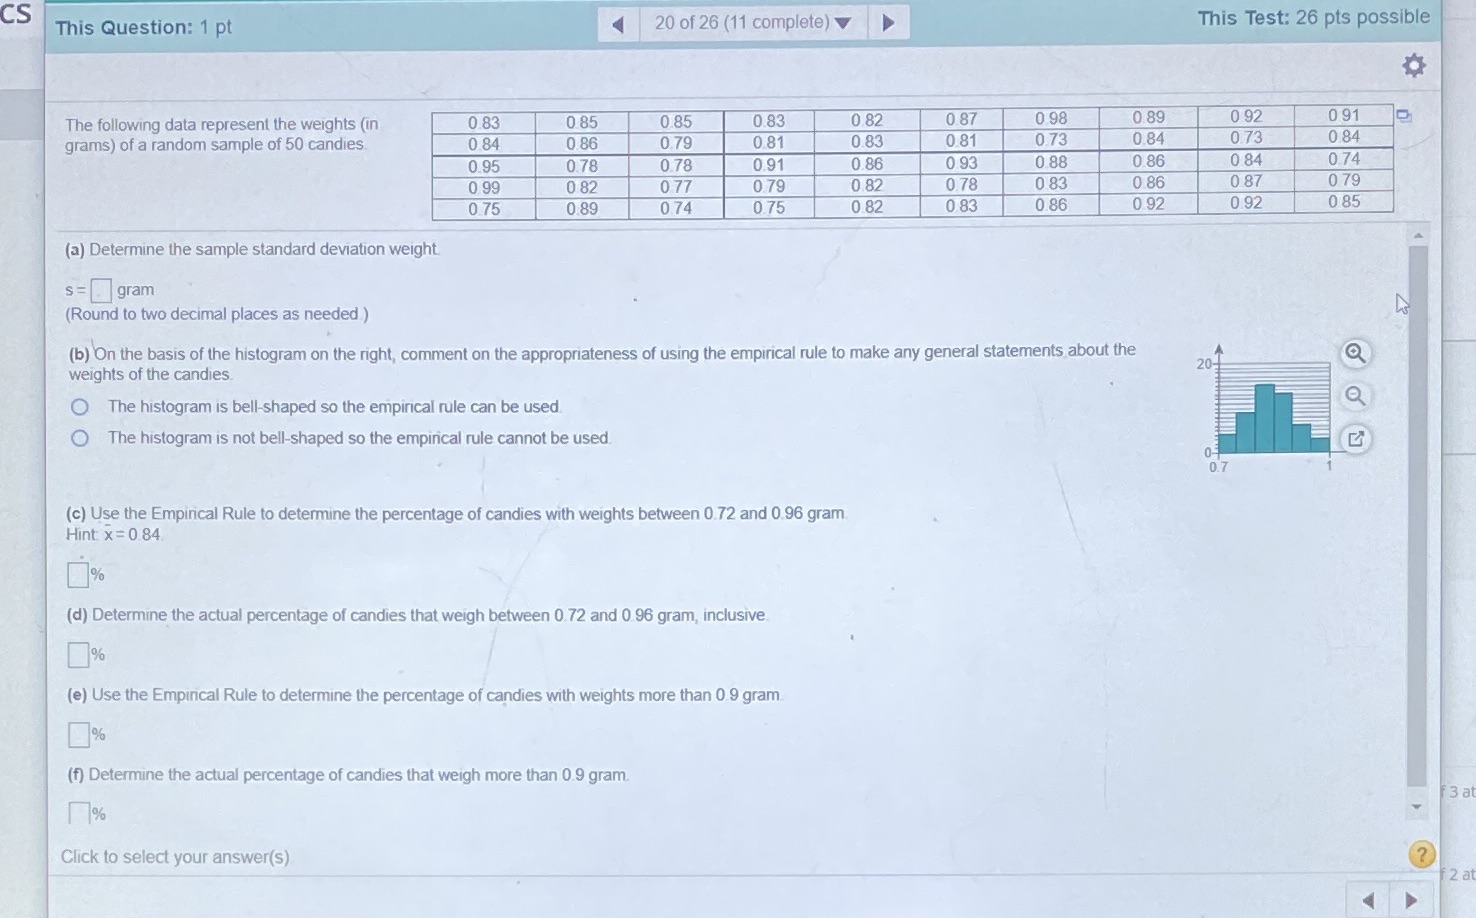
CS This Question: 1 pt 20 of 26 (11 complete) This Test: 26 pts possible The following data represent the weights (in 0.83 0 85 0.85 0.83 0 82 0 87 0 98 0.89 0 92 091 grams) of a random sample of 50 candies. 0 84 0.86 0.79 0.81 0 83 0 81 0.73 0.84 073 0.84 0.95 0.78 0.78 0.91 0.86 0 93 0.88 0.86 0 84 074 0 99 0 82 0 77 0 79 0 82 0.78 0 83 0 86 087 0 79 075 0.89 0.74 0.75 0 82 0 83 0.86 0.92 0.92 0 85 (a) Determine the sample standard deviation weight s= gram (Round to two decimal places as needed ) (b) On the basis of the histogram on the right, comment on the appropriateness of using the empirical rule to make any general statements about the weights of the candies. 20- O The histogram is bell-shaped so the empirical rule can be used The histogram is not bell-shaped so the empirical rule cannot be used. 0- (c) Use the Empirical Rule to determine the percentage of candies with weights between 0.72 and 0.96 gram. Hint: x = 0 84. % (d) Determine the actual percentage of candies that weigh between 0.72 and 0.96 gram, inclusive % (e) Use the Empirical Rule to determine the percentage of candies with weights more than 0.9 gram % (f) Determine the actual percentage of candies that weigh more than 0.9 gram. 17% 3 a Click to select your answer(s) ? 2 at
Step by Step Solution
There are 3 Steps involved in it

Get step-by-step solutions from verified subject matter experts