

Question: Please help me solve this asap! The first screenshot is the problem I need help with. The second screenshot is a finished example problem so
Please help me solve this asap! The first screenshot is the problem I need help with. The second screenshot is a finished example problem so your answer should look similar. Thanks in advance!
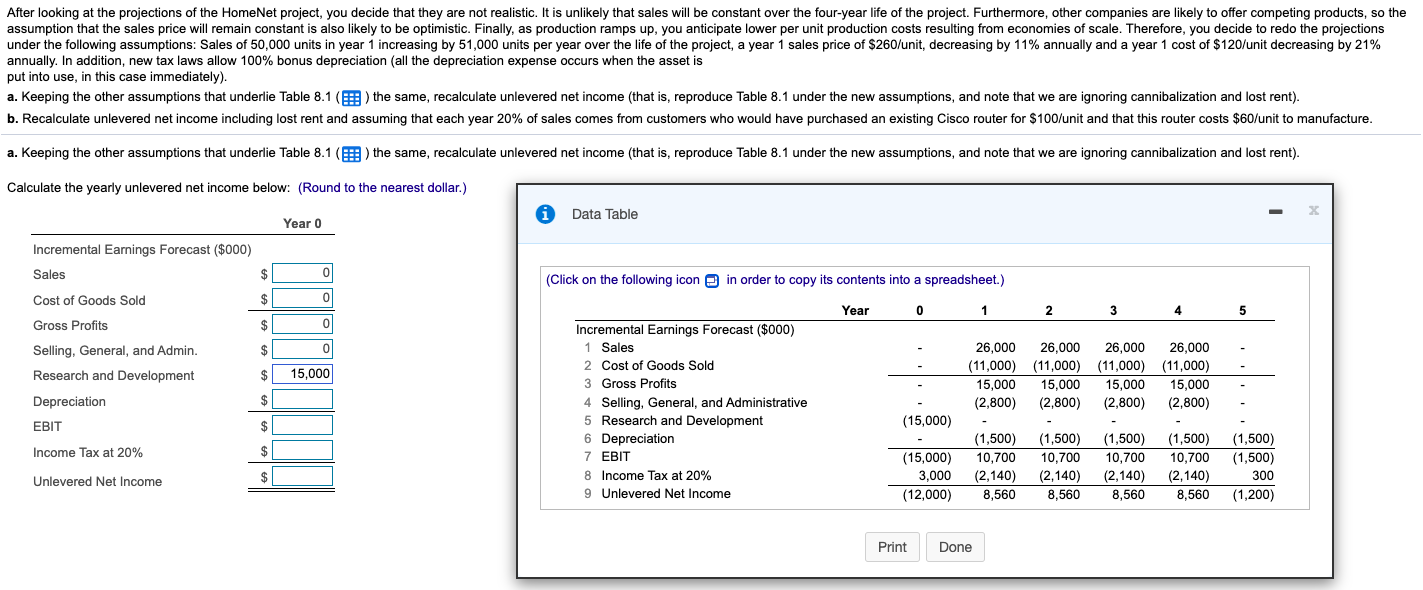
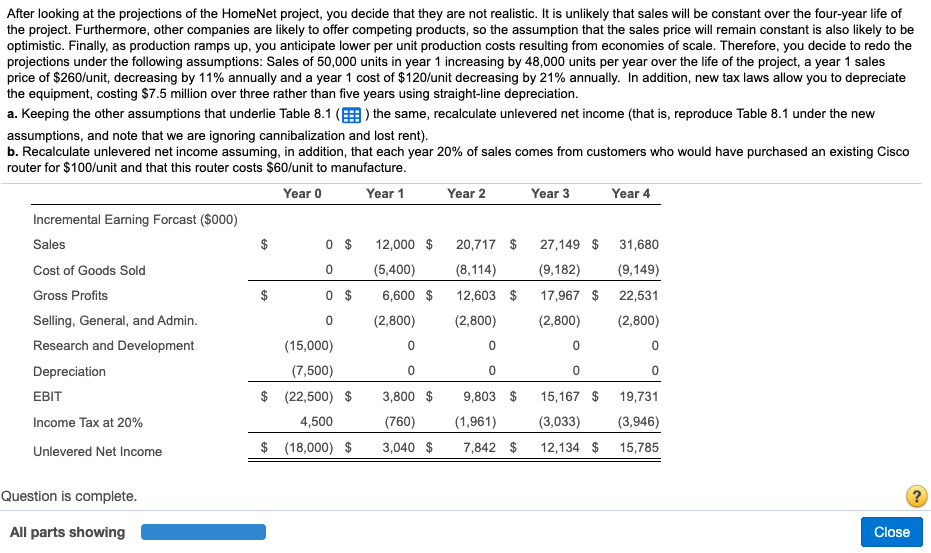
After looking at the projections of the HomeNet project, you decide that they are not realistic. It is unlikely that sales will be constant over the four-year life of the project. Furthermore, other companies are likely to offer competing products, so the assumption that the sales price will remain constant is also likely to be optimistic. Finally, as production ramps up, you anticipate lower per unit production costs resulting from economies of scale. Therefore, you decide to redo the projections under the following assumptions: Sales of 50,000 units in year 1 increasing by 51,000 units per year over the life of the project, a year 1 sales price of $260/unit, decreasing by 11% annually and a year 1 cost of $120/unit decreasing by 21% annually. In addition, new tax laws allow 100% bonus depreciation (all the depreciation expense occurs when the asset is put into use, in this case immediately). a. Keeping the other assumptions that underlie Table 8.1(E) the same, recalculate unlevered net income (that is, reproduce Table 8.1 under the new assumptions, and note that we are ignoring cannibalization and lost rent). b. Recalculate unlevered net income including lost rent and assuming that each year 20% of sales comes from customers who would have purchased an existing Cisco router for $100/unit and that this router costs $60/unit to manufacture. a. Keeping the other assumptions that underlie Table 8.1 () the same, recalculate unlevered net income (that is, reproduce Table 8.1 under the new assumptions, and note that we are ignoring cannibalization and lost rent). Calculate the yearly unlevered net income below: (Round to the nearest dollar.) Data Table Year o Incremental Earnings Forecast ($000) Sales $ (Click on the following icon in order to copy its contents into a spreadsheet.) Cost of Goods Sold $ 0 Year 0 1 2 3 4 5 Gross Profits $ 0 $ 0 Selling, General, and Admin. Research and Development Depreciation $ 15,000 26,000 (11,000) 15,000 (2,800) 26,000 (11,000) 15,000 (2,800) 26,000 (11,000) 15,000 (2,800) 26,000 (11,000) 15,000 (2,800) $ Incremental Earnings Forecast ($000) 1 Sales 2 Cost of Goods Sold 3 Gross Profits 4 Selling, General, and Administrative 5 Research and Development 6 Depreciation 7 EBIT 8 Income Tax at 20% 9 Unlevered Net Income EBIT $ (15,000) Income Tax at 20% $ (1,500) 10,700 (2,140) 8,560 (1,500) 10,700 (2,140) 8,560 (15,000) 3,000 (12,000) (1,500) 10,700 (2,140) 8,560 (1,500) 10,700 (2,140) 8,560 (1,500) (1,500) 300 (1,200) Unlevered Net Income $ Print Done After looking at the projections of the HomeNet project, you decide that they are not realistic. It is unlikely that sales will be constant over the four-year life of the project. Furthermore, other companies are likely to offer competing products, so the assumption that the sales price will remain constant is also likely to be optimistic. Finally, as production ramps up, you anticipate lower per unit production costs resulting from economies of scale. Therefore, you decide to redo the projections under the following assumptions: Sales of 50,000 units in year 1 increasing by 48,000 units per year over the life of the project, a year 1 sales price of $260/unit, decreasing by 11% annually and a year 1 cost of $120/unit decreasing by 21% annually. In addition, new tax laws allow you to depreciate the equipment, costing $7.5 million over three rather than five years using straight-line depreciation. a. Keeping the other assumptions that underlie Table 8.1 (6) the same, recalculate unlevered net income (that is, reproduce Table 8.1 under the new assumptions, and note that we are ignoring cannibalization and lost rent). b. Recalculate unlevered net income assuming, in addition, that each year 20% of sales comes from customers who would have purchased an existing Cisco router for $100/unit and that this router costs $60/unit to manufacture. Year 0 Year 1 Year 2 Year 3 Year 4 Incremental Earning Forcast ($000) Sales 0 $ 12,000 $ 20,717 $ 27,149 $ 31,680 Cost of Goods Sold (5,400) (8,114) (9,182) (9,149) Gross Profits 0 $ 6,600 $ 12,603 $ 17,967 $ 22,531 Selling, General, and Admin. (2,800) (2,800) (2,800) (2,800) Research and Development (15,000) 0 0 Depreciation (7,500) 0 0 EBIT $ (22,500) $ 3,800 $ 9,803 $ 15,167 $ 19,731 Income Tax at 20% 4,500 (760) (1,961) (3,033) (3,946) Unlevered Net Income $ (18,000) $ 3,040 $ 7,842 $ 12,134 $ 15,785 $ 0 LA 0 0 0 0 Question is complete. All parts showing Close
Step by Step Solution
There are 3 Steps involved in it

Get step-by-step solutions from verified subject matter experts